Automated Brilliance by EMD's in Raman Spectroscopy
Automated Smoothing and Baselining through Empirical Mode Decomposition

Raman spectroscopy, a powerful analytical technique, has emerged as a cornerstone in materials science, chemistry, and biology, providing invaluable insights into molecular structures and vibrational modes. However, amidst the wealth of information embedded in Raman spectra, the raw data often presents challenges in the form of baseline offsets and noise. In the pursuit of extracting meaningful information, researchers turn to pre-processing methods, particularly baselining and smoothing, as indispensable tools for enhancing the clarity and interpretability of Raman spectra.
In order to increase the signal-to-noise ratio, smoothing methods such as the Savitzky-Golay (SG) algorithm. SG is a frequently employed technique for diminishing noise in Raman spectra. This method involves fitting a polynomial function to each segment of the initial Raman spectrum within a defined window during the SG smoothing process.
Furthermore, Raman since Raman modes vary in intensity. In order to interpret the Raman peaks fairly, the background fluorescence is subtracted to baseline the signal. Savitzky-Golay is also used to fit a polynomial across the whole length of the spectrum.
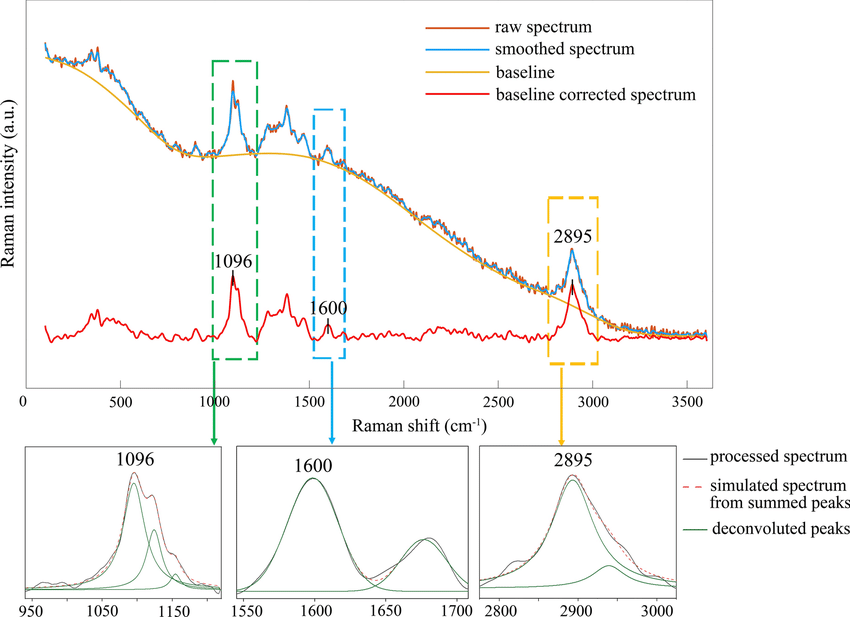
Figure: The raw Raman spectrum, smoothed Raman spectrum, baseline of Raman spectrum, baseline corrected Raman spectrum and the e deconvolution results of the specific Raman peaks located at a 1096 cm⁻¹; b1600 cm⁻¹; and c 2895 cm⁻¹ [1]
Albeit that this method has been popularised due to its simplicity and ease of use, the use of SG faces a dilemma when approached with huge volumes of data such as Raman maps, and time-based processed spectra. Selecting the strength of the smoothing tool, the window size and the degree of the polynomial fitting for each Raman spectrum becomes time-consuming for massive volumes of data.
In this article, we’ll demonstrate how to use Empirical Mode Decomposition (EMD) as a method which can be fully automated for large data sets of Raman spectra. [2]
What causes fluorescence?
Laser-Induced Heating
The intense laser light employed to excite the sample in Raman spectroscopy can inadvertently lead to laser-induced heating. This thermal effect causes fluctuations in the sample's temperature, resulting in additional signals that contribute to the overall noise. Minimizing laser power and optimizing experimental conditions help mitigate the impact of laser-induced heating.
Scattering from Impurities or Particles
Fluctuations in Raman signals can arise from the scattering of incident laser light by impurities or particles within the sample. These impurities may exhibit their own spectral features, introducing unwanted noise into the Raman spectrum.
Electronic Noise
Inherent electronic noise in the Raman spectrometer, stemming from imperfections in detectors, amplifiers, or other electronic components, can contribute to baseline fluctuations and distort the measured spectrum. Regular maintenance, calibration, and signal processing techniques are employed to reduce electronic noise and enhance signal quality.
Shot Noise
Shot noise, a consequence of the discrete nature of photon detection, can introduce random fluctuations in the recorded signal. In Raman spectroscopy, shot noise can manifest as variations in the background signal, contributing to overall noise levels. Techniques such as longer integration times and signal averaging help mitigate the impact of shot noise.
What causes fluorescence?
Electronic Transitions
Fluorescence in Raman spectroscopy often arises from electronic transitions within the sample. When the incident laser excites the molecules, electrons may jump to higher energy levels and subsequently return to lower levels, emitting fluorescence in the process.
Conjugated Systems
Molecules with conjugated systems, where alternating single and multiple bonds create extended π-electron systems, are particularly prone to fluorescence. The presence of conjugated systems enhances the likelihood of electronic transitions, leading to fluorescence signals.
Impurities and Contaminants
The presence of impurities or contaminants in the sample can contribute significantly to fluorescence in Raman spectra. These extraneous substances may possess inherent fluorescence properties, introducing additional signals that mask the desired Raman signals.
Excitation Wavelength
The choice of excitation wavelength plays a pivotal role in inducing fluorescence in Raman spectroscopy. If the excitation wavelength closely aligns with electronic transition energies within the sample, fluorescence becomes more pronounced. Researchers must carefully select excitation wavelengths to minimize interference from fluorescence, for instance, changing the laser from 628 nm to 785 nm will shift the fluorescence into a different segment of wavenumbers, while keeping the Raman bands in the same location.
The EMD algorithm
The EMD algorithm initially came from work conducted by electrical engineers To extract the Intrinsic Mode Functions (IMFs) from the original signal, we pass the signal through a filtering and testing algorithm. The EMD algorithm finds the local maximum and minimum of the signal, apply two cubic splines to connect the maxima and minima, and find an average function of the cubic splines:
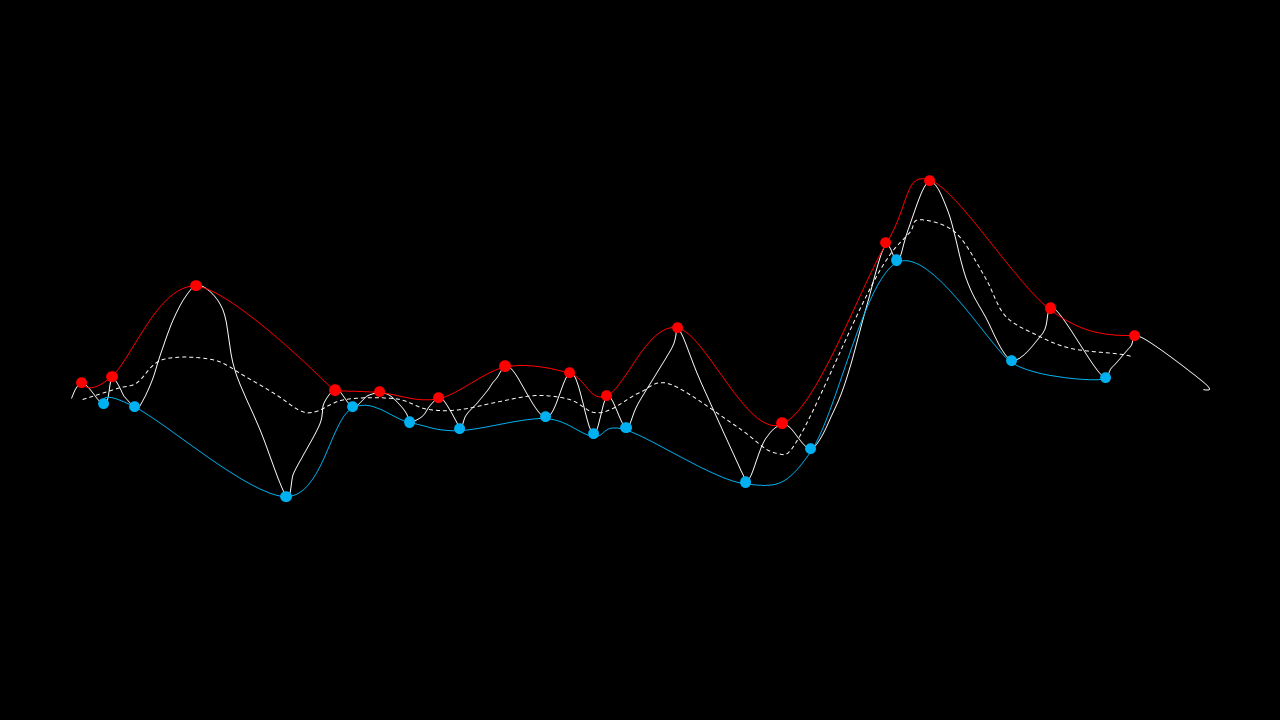
The average function is subtracted from the original signal to produce a residual.
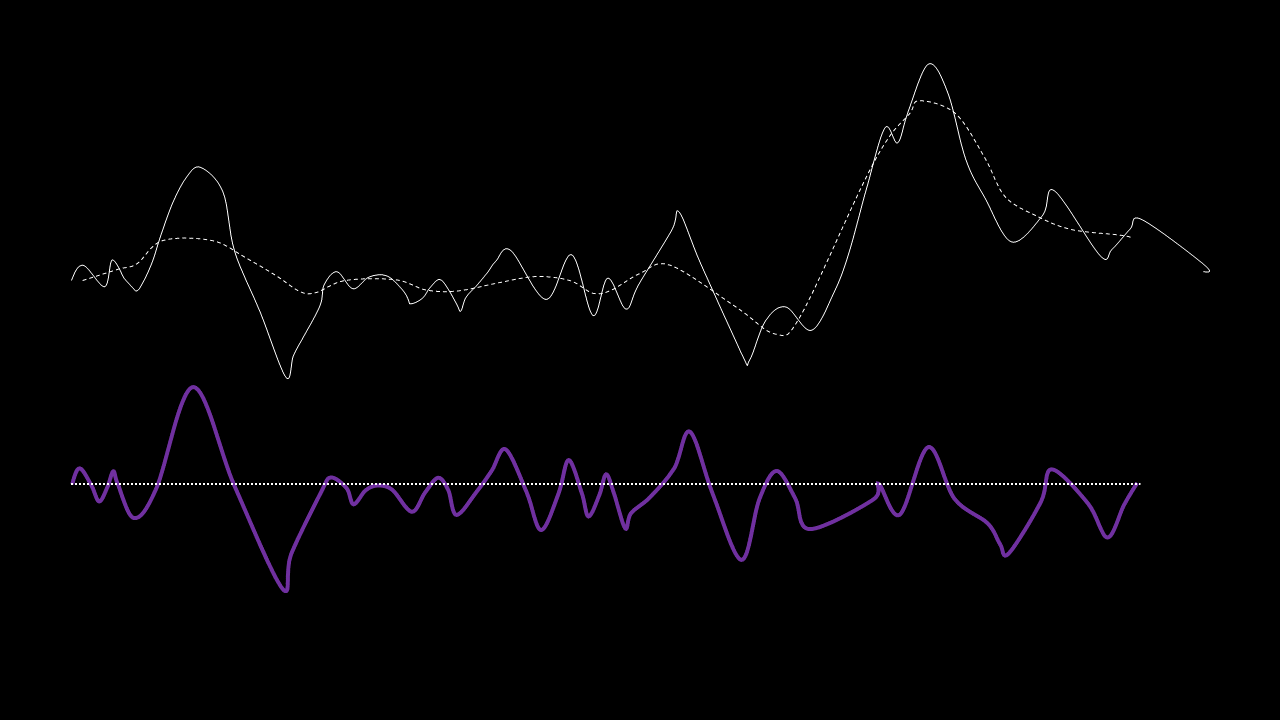
This residual is tested for zero mean. If mean of residue is (close to) zero and if the number of extrema and the number of zero crossings are either equal or differ at most by one, this is the first IMF.
If, on the other hand, this is NOT true, the residual is passed again through the maxima-minima-cubic-spline-filter until the condition is true.
The IMF filter can be summarised by this pathway:
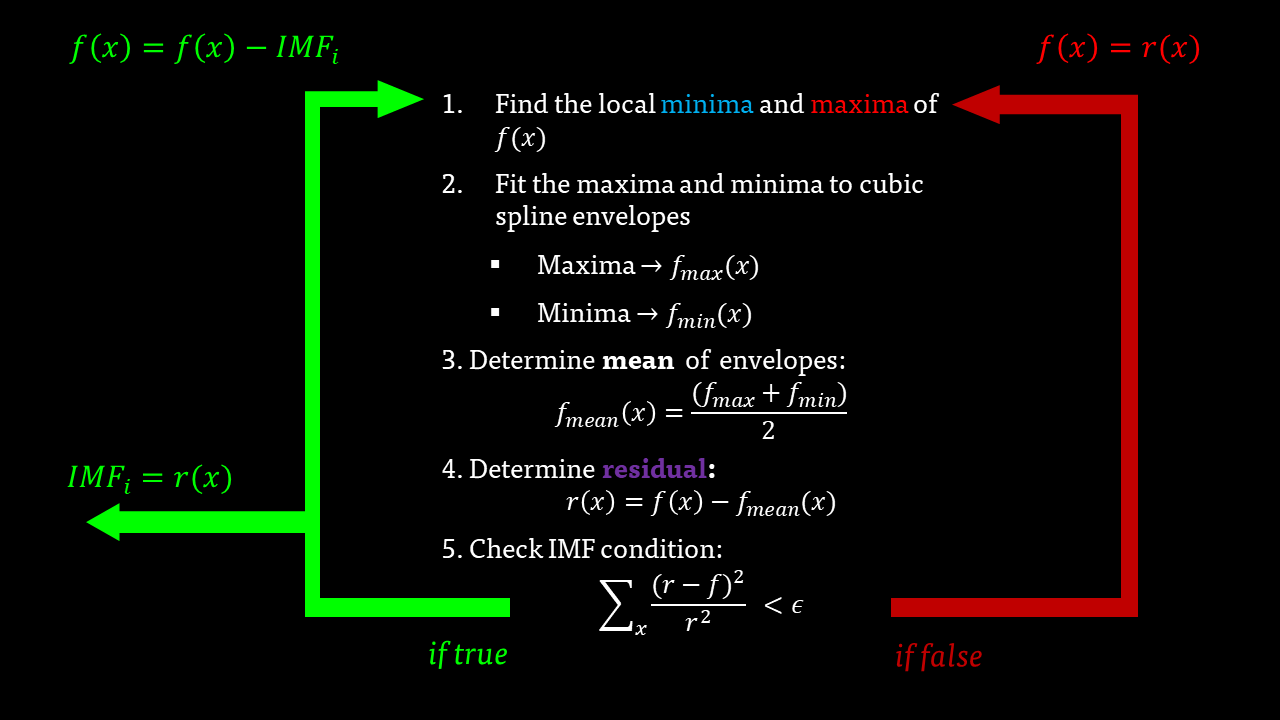
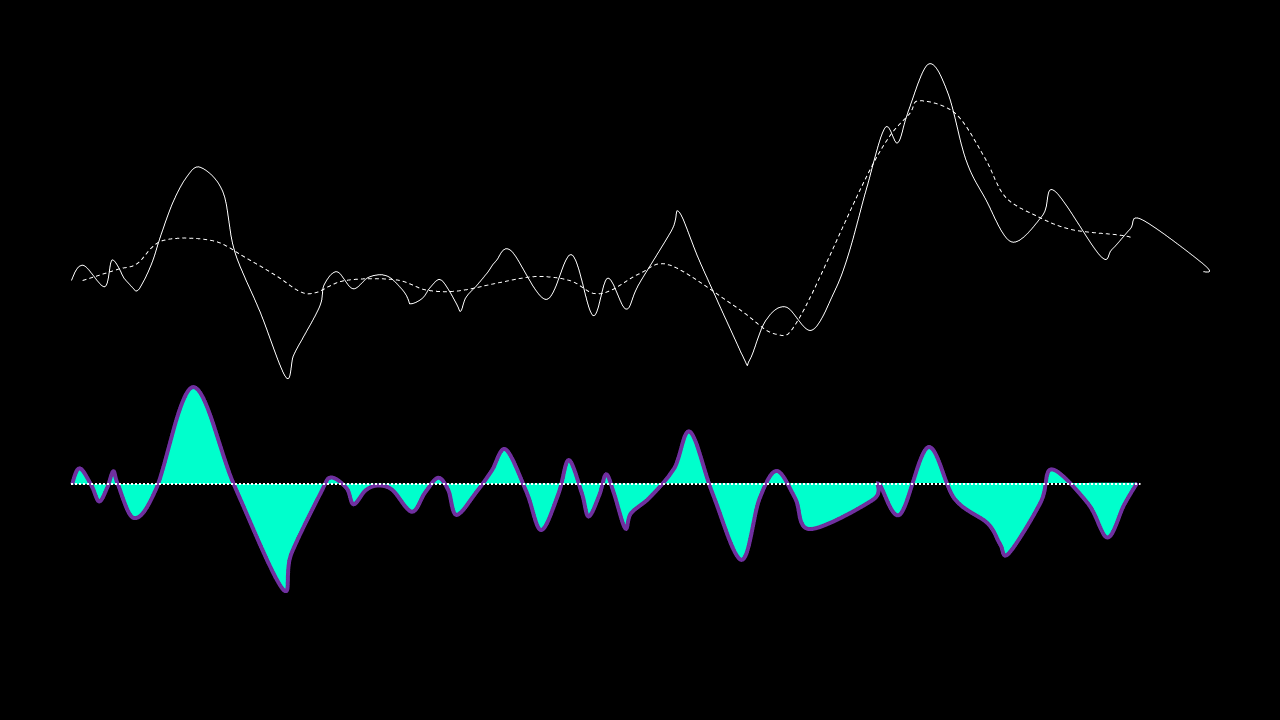
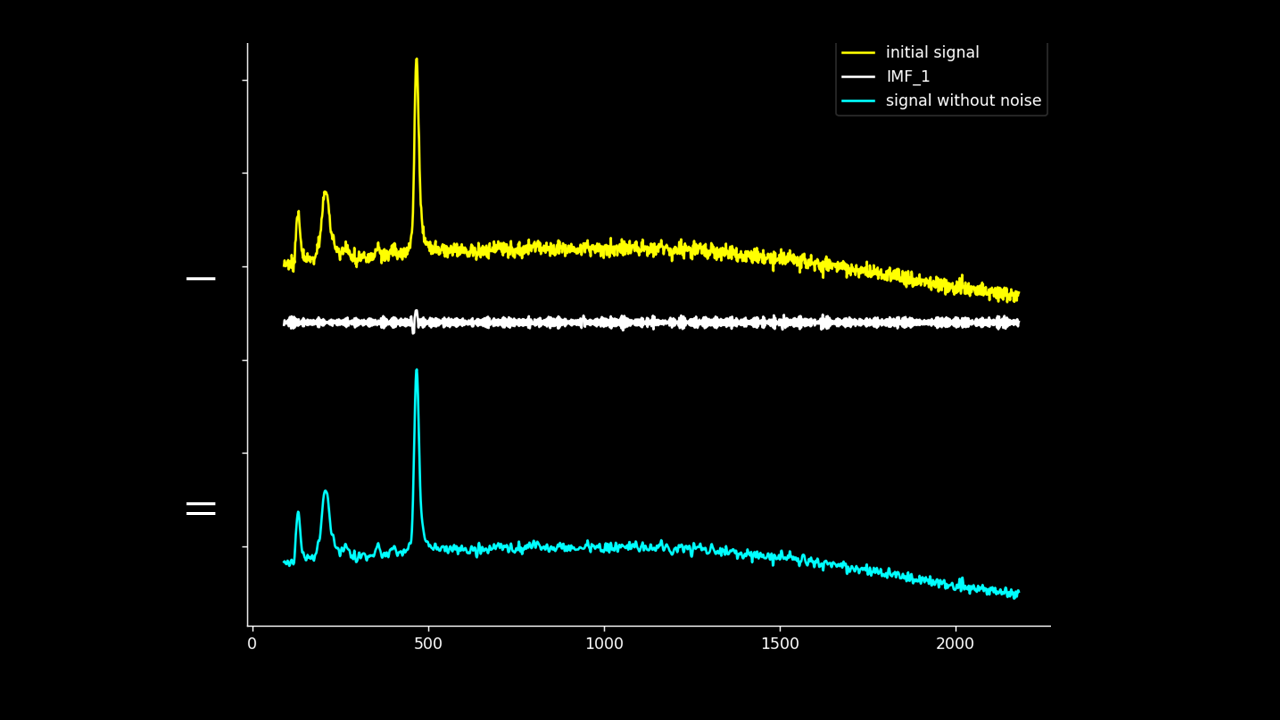
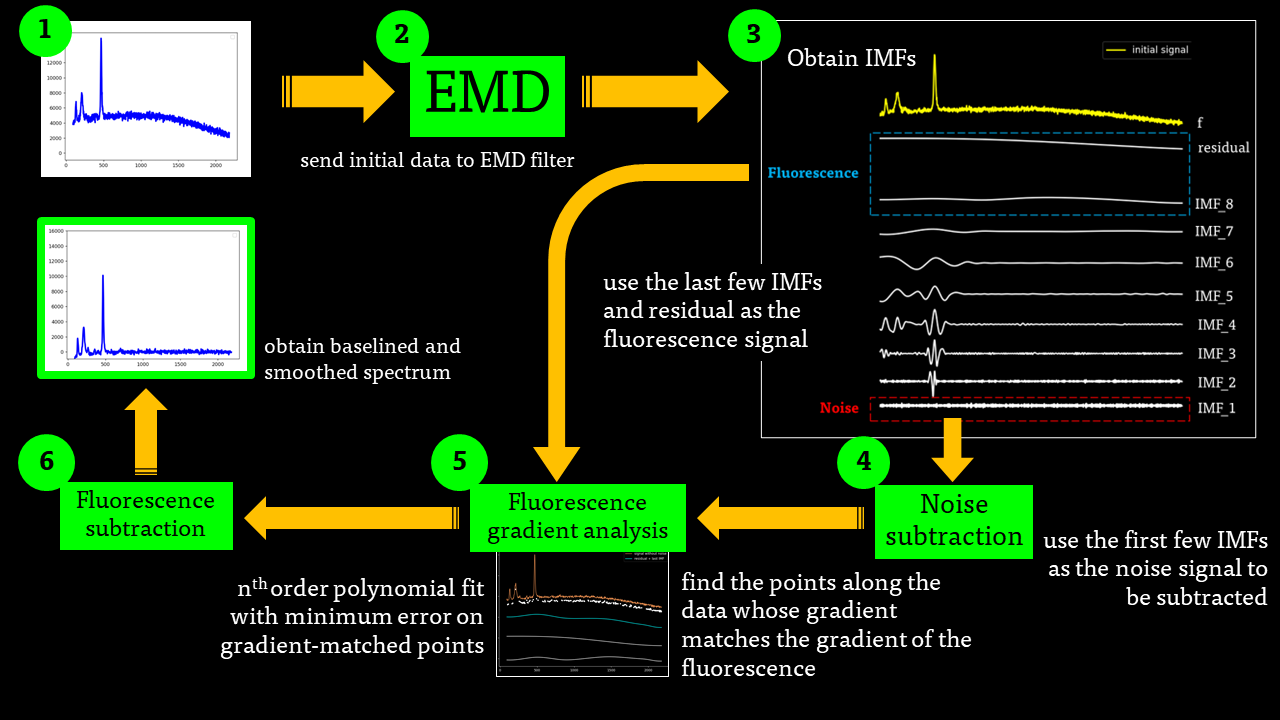
The IMFs of a common Raman signal is obtained. Note that the sum of the IMFs create the original signal:
Firstly, the noise can be noted as the first IMF (or first few IMFs depending on the level of noise). This can be subtracted from the Raman signal to obtain a smoother signal.
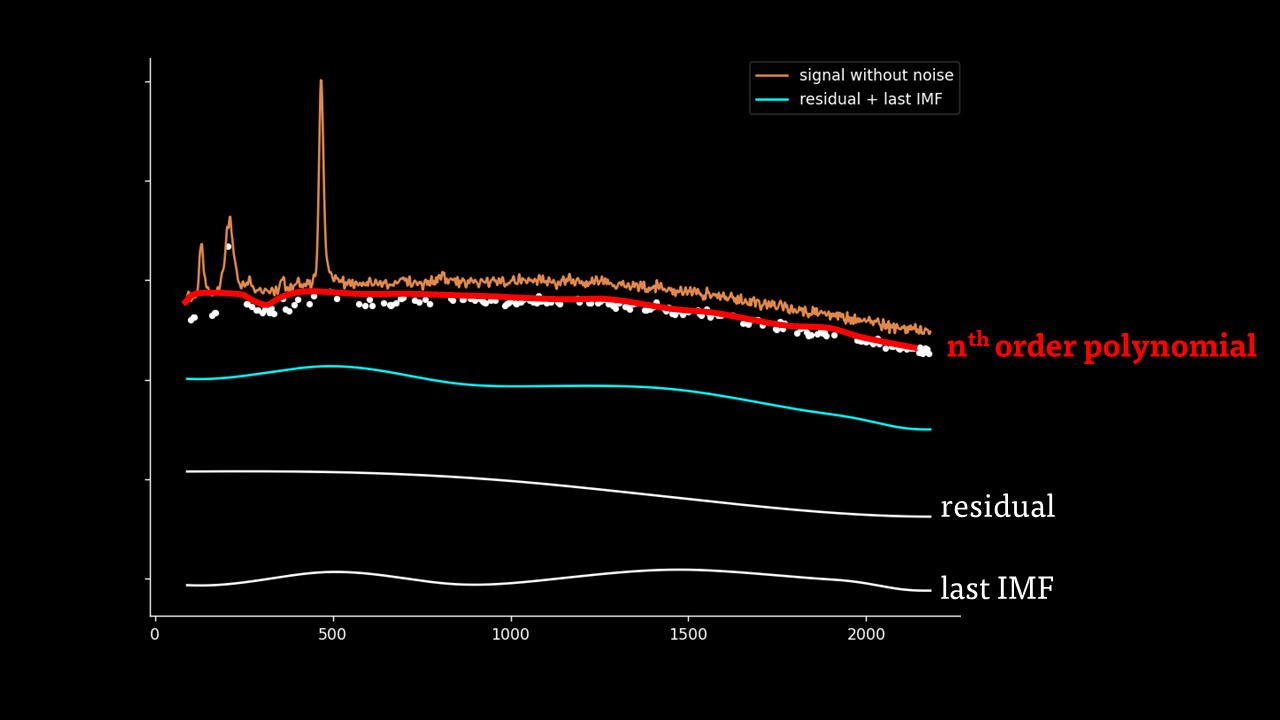
Secondly, the last few IMFs can be approximated as the fluorescence pattern. As the IMF intensities don’t exactly match the fluorescence, points along the original signal are tested for matching the gradient of the IMF sum that we model as the fluorescence. This stables points along the spectrum which are part of the fluorescence and are not part of the Raman peaks we wish to separate. A polynomial function is fitted to these points such that the overall error is minimised across the entire window of the spectrum.
Lastly, the fluorescence polynomial is subtracted from the signal without noise, giving a baselined Raman signal.
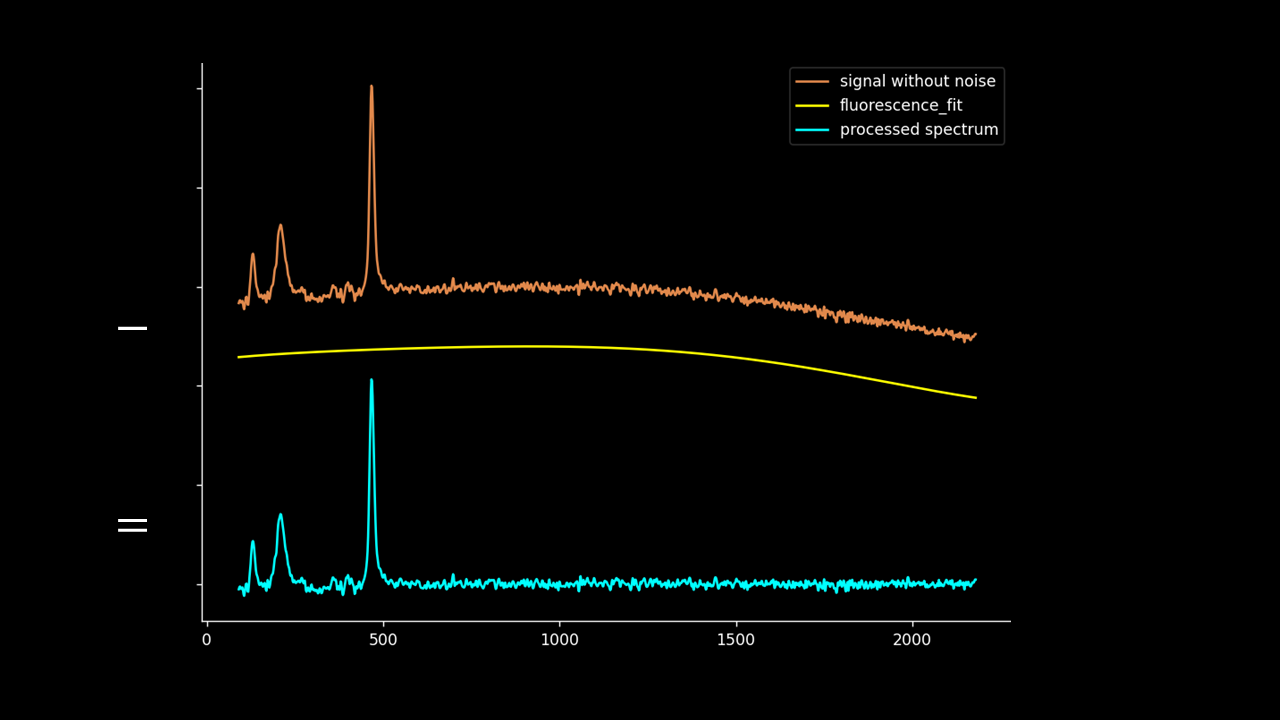
Note that the “noise” isn’t fully subtracted. This allows variation to be retained such that the spectrum can be passed to PCA, DFA and other chemometric techniques.
The implementation of the automated signal processing system as EMD in analytical techniques represents a paradigm shift in data processing, offering advantages that transcend the constraints of user-defined parameters. Unlike traditional methods where users manually set values or filtering strengths based on their subjective judgment or empirical experience, an automated signal processing approach introduces a dynamic and adaptive system that responds intelligently to the characteristics of the data.
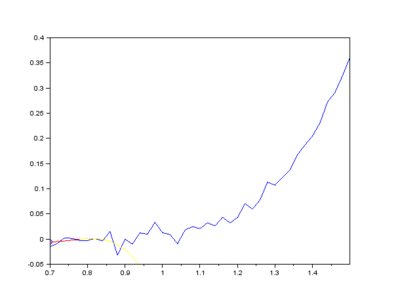
This method also gives the user the ability to store the fluorescence pattern if they wish to do fluorescence studies of samples. For example, during the whisky distillation process, the fluorescence level changes overtime in a non-linear regression; retaining the fluorescence will give researchers (and alcoholics) the ability to map out the chemistry of whisky as the barrel wood infuses with the alcohol.[3] Retaining the fluorescence is also useful in time-gated studies since the Raman emission occurs before the fluorescence emission on the pico-second scale. Changing the time window of the detector at this scale can discriminate between the Raman and fluorescence, while keeping both. [4]
Up Next?
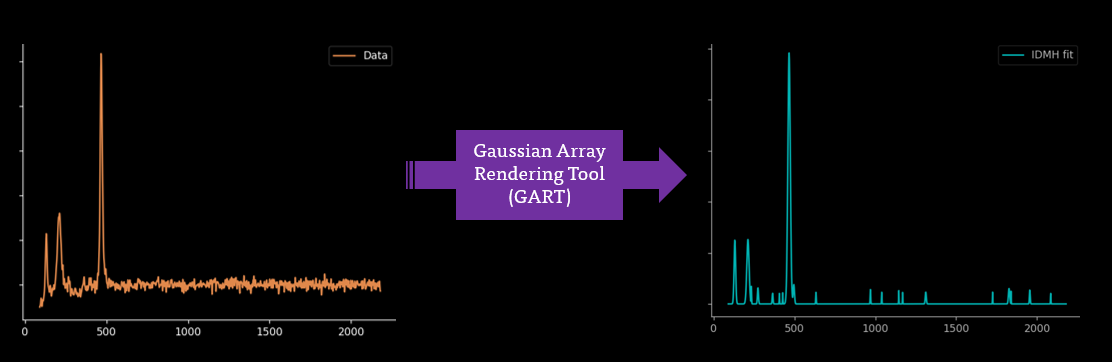
I'm jealous of Mass Spectrometry and its ability to acquire fully baselined and clear spectra. I'm hoping that this automated process can be continued further to fully baselining and smoothing through Gaussian Rendering Tool and Indirect Spectral Hard Modelling:
References
[1] Gao, Wenli and Zhou, Liang and Guan, Ying and Gao, Hui and Liu, Kai, 2022, Monitoring the kappa number of bleached pulps based on FT-Raman spectroscopy' Cellulose, vol. 29.
[2] LEÓN-BEJARANO, F., MÉNDEZ, M. O., RAMÍREZ-ELÍAS, M. G. & ALBA, A. 2019. ‘Improved Vancouver Raman Algorithm Based on Empirical Mode Decomposition for Denoising Biological Samples’, Appl. Spectroscopy, 73, 1436-1450.
[3] Fleming , H , Chen , M , Bruce , G D & Dholakia , K 2020 , ' Through-bottle whisky sensing and classification using Raman spectroscopy in an axicon-based backscattering configuration ' , Analytical Methods , vol. 12 , no. 37 , pp. 4572-4578.
[4] N. Finlayson, H. McEwan, 2023, ‘Time-correlated Raman imaging with a SPAD line sensor’, SPIE vol. 12373.