Mini Raman Marvel: Elevating Food and Liquor Inspection
Revisiting the device threw me into Raman spectroscopy
Rarely does an undergraduate thesis ever get read or become available online for the future. In fact, most cases, they get thrown onto the ever growing pile of knowledge and events of the past. It is my hope that by writing this online, I can reach a wider audience for those wishing to repeat upon or develop my project further —albeit that industries across the world have already done so.
Today, I take my time to walk you through the very project which enthralled me to get involved with Raman Spectroscopy.
Some of the earliest Raman microscopes weighed a tonne! And were extremely expensive and could only be afforded (and used) by a few wealthy institutions.
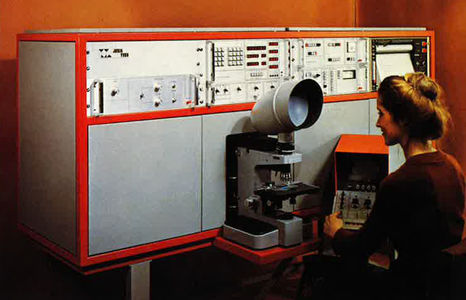
First Raman microscope leading to imaging: MOLETM, (1976), Credit: HORIBA
Over the decades, Raman devices have been shrinking in size and cost. While Raman microscopes remain rather bulk and require specialised installations, many task-specific Raman analysers have been shrinking past this and perform very well for the task designed in food safety (in regards to milk analysis), pharmaceuticals (drug identification) and security (explosive detection).
Just last March 2023, BaySpec announced the smallest ever Raman analyser which have utilised the latest advancements in microelectronics. As a result, the BaySpec produced an instrument weighing 59g, equivalent in size to a key chain! It possesses the capability to detect any molecule within the fingerprint region (450–2300 cm-1), making it the most compact and lightweight Raman spectrometer currently available. Having had no experience using this device myself, this device is truly compact. So compact that a USB connection wouldn’t be possible to relay the data, but rather, each Mini Wearable is equipped with Bluetooth which can send spectral data to another device. Pretty impressive!
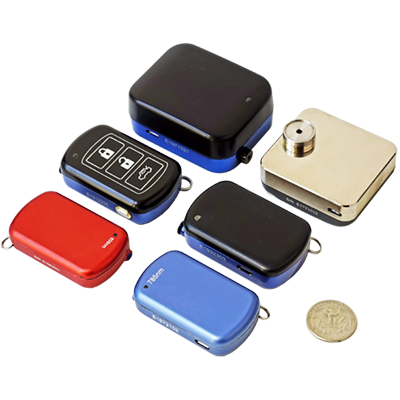
SERS (Surface Enhanced Raman Scattering) Substrate & SERS Reader – Mini Chemistry Analytic Pack, Credit: BaySpec.
This was the concern of my own project, 'A compact Raman system for food and liquor inspection' . With a budget of £12,000, I constructed a compact Raman analyser. The biggest constraint for me was that my component sizes depended on the products of ThorLabs, a large manufacturer of standard optical components; whereas BaySpec has a plethora of compact micro systems on the free market. Which, until directly working in industry, I had no idea how fast and how far this technology has come
So let's begin the thesis of May 2022!
_________________________________________________________________________________________
Acknowledgements
I would like thank both of my supervisors Dr Graham Bruce and Dr Mingzhou Chen, for overseeing the project and their willingness to guide and assist this development as well as their dedication and constant support. I would also like to thank Christopher Booth for designing the electronics for the interlock system in conjunction with an unusual laser circuitry. I would further like to thank Mark Robertson and his workshop team for making the sample holder as well as assembling the system enclosure.
I would further like to thank my friends, for being friends.
1 Abstract
This thesis delivers the development of constructing a portable and compact Raman spectroscopy device capable of chemical analysis in the food and beverage industry. We focus on improving the compactness and portability of such a device to analyse various liquid chemicals. We highlight initial construction and optimisation as well as showcase the multipurpose use of this device to differentiate between a variety of whisky and alcoholic beverages. We focus on further applications in detecting contaminants of substances in alcoholic drinks and evaluate the effectiveness of the system. We later employing MATLAB software and Principal Component Analysis (PCA) for a demonstration to a public audience. Identifying Raman traces characteristic to different samples is achieved.
2 Introduction
The importance of Raman Spectroscopy (RS) in chemical analysis is attributed to its non-destructive and label-free methods (label-free meaning without requiring any stable isotope ‘tag’ to bind to a molecule/protein to identify its quantity; preparation time and cost is reduced (1)). RS has been used in chemical identification in a variety of fields such as archaeology (2), disease analysis (3), cancer screening (4) , herbal medicines (5), cooking oils (6), (7) and alcoholic substances (8), (9). The diversity of areas that this technique has been used in gives motivation and confidence that it can also be applied in this project.
2.1 Raman Theory
First observed in 1928 by C.V. Raman (10), who later won the Nobel Prize for his discovery (11), the effect that bears his name describes the frequency shifts characteristic of inelastically scattered light, revealing the properties of the molecules it has been scattered from. The initial theory was developed via an explanation of simple harmonic motion of atoms, connected by a chemical bond e.g. C=C, C−H2, N−C=O. In spectroscopy, incident monochromatic light radiating on molecule raises it to a higher virtual energy state (see Figure 2.1), where it then will fall back to the same ground state, thus emitting light of the same incident wavelength. The majority of scattering photons are scattered elastically in this process, where the incident photons have the same energy as the scattered photons (known as Rayleigh scattering). However, the oscillating electric field of the laser light may interact with the atom-bond complex, inducing simple harmonic motion in the bond and the system to vibrate. This process induces inelastic scattering, where the vibrational and rotational modes absorb some of photon’s energy such that with an incident ray of frequency 𝜔𝑖 , a scattered photon of frequency 𝜔𝑘 is produced, where a change in energy Δ𝐸 = ℎ𝜔𝑖 − ℎ𝜔𝑘 relates to the energy absorbed by the molecule. Energy has been transferred from the light to the molecule via these vibrational modes. This process is known as Raman-Stoke scattering and the Stoke-scattered light is red-shifted (𝜔𝑖 > 𝜔𝑘). Thus the vibrational modes of molecular bonds are imprinted into the wavelength spectrum of the scattered light, revealing the specific chemical fingerprint of the substance. (12)
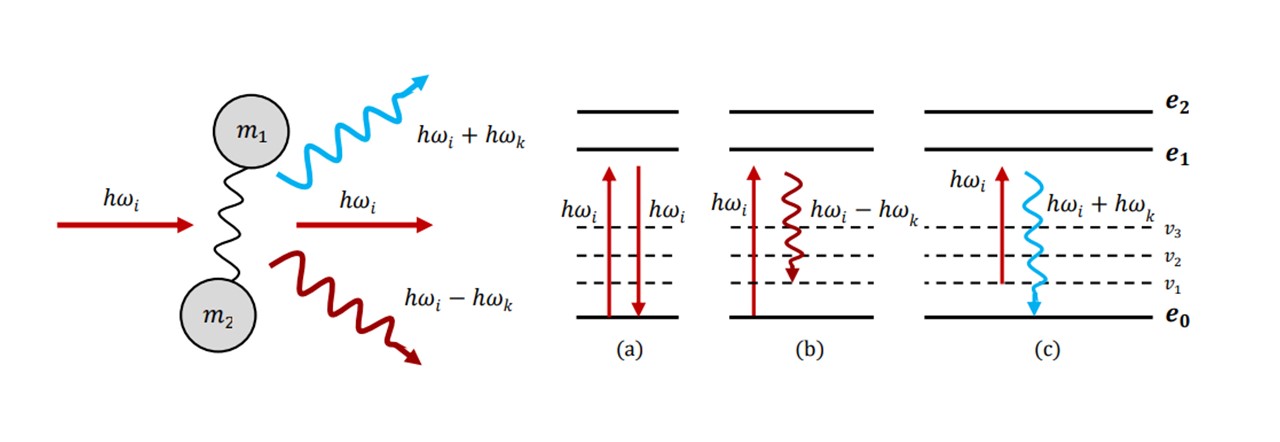
Figure 2.1 : (left) atom-bond complex treated as a simple harmonic oscillator which partially absorbs or adds energy to the incident photon to produce a photon of different energy from the incident, (right) the change in energy levels and vibrational energy levels correspond to a specific type of scattering: (a) Rayleigh scattering, (b) Stoke scattering (c) Anti-Stoke scattering.
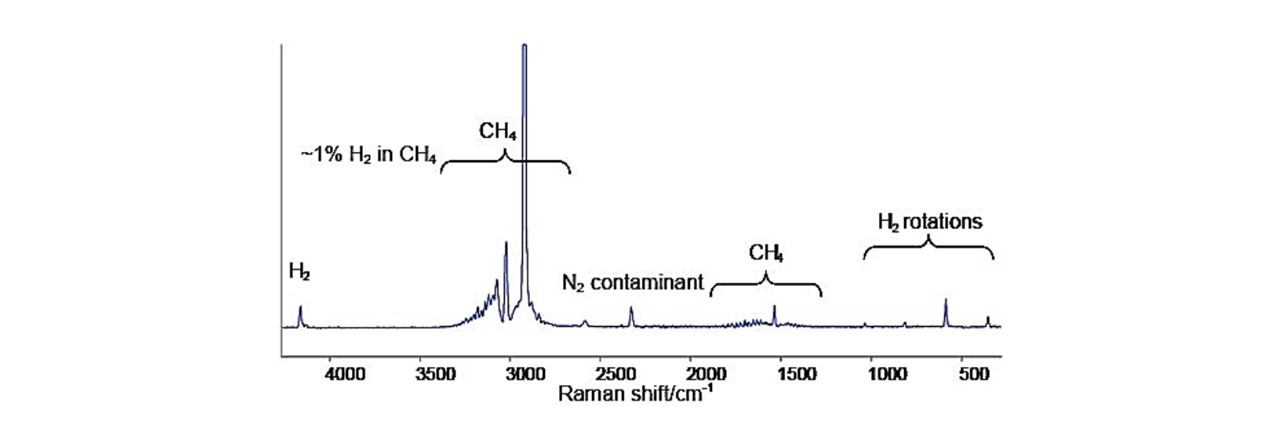
See Figure 2.2 as an example of the Raman shift spectrums produced for methane.
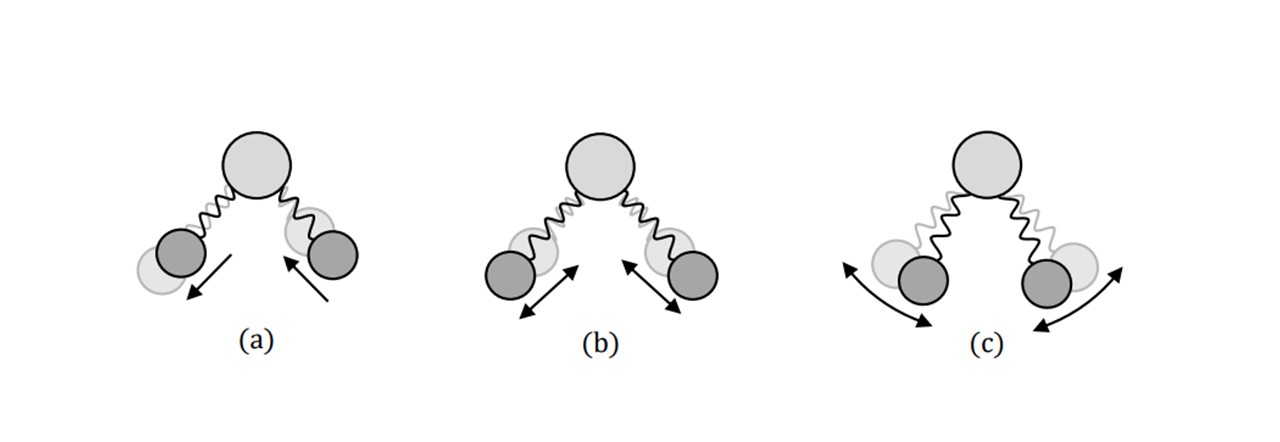
Figure 2.2 : Raman spectrum of methane-hydrogen mixture displaying large 2917cm−1 peak, characteristic of methane (CH4) (13)
This shift in wavelength directly reveals the vibrations between the atoms in a molecule. Since every molecule’s vibrational properties depend on their constituent atomic components, the Raman spectrum of every molecule is specific and unique, allowing one to differentiate between multiple unknown samples. The shift in frequency can be realised theoretically (14) by treating the vibrations as simple harmonic oscillators (Figure 2.3).

Figure 2.3: There are also types of vibrations between the bonds to consider as well. Namely, antisymmetric (a) and symmetric (b) stretching: the length change of the bonds, as well as bending (c): the rotational change of the connected atom’s position.
Agreeing with a classical scenario, heavier atom combinations, such as S=O in sulphur-dioxide vibrate at low frequencies (1151 cm-1 symmetrically (14)), whereas lighter bonded atoms such as C=O carbon dioxide vibrate at higher frequencies (1333 cm-1 symmetrically (14)). Each Raman shift, 𝜎𝑅𝑎𝑚𝑎𝑛 (in relative wavenumbers (cm 1)), corresponds to the wavelength of the excitation laser, 𝜆𝑒𝑥𝑐, and the wavelength of the scattering light, 𝜆𝑠𝑐, by:
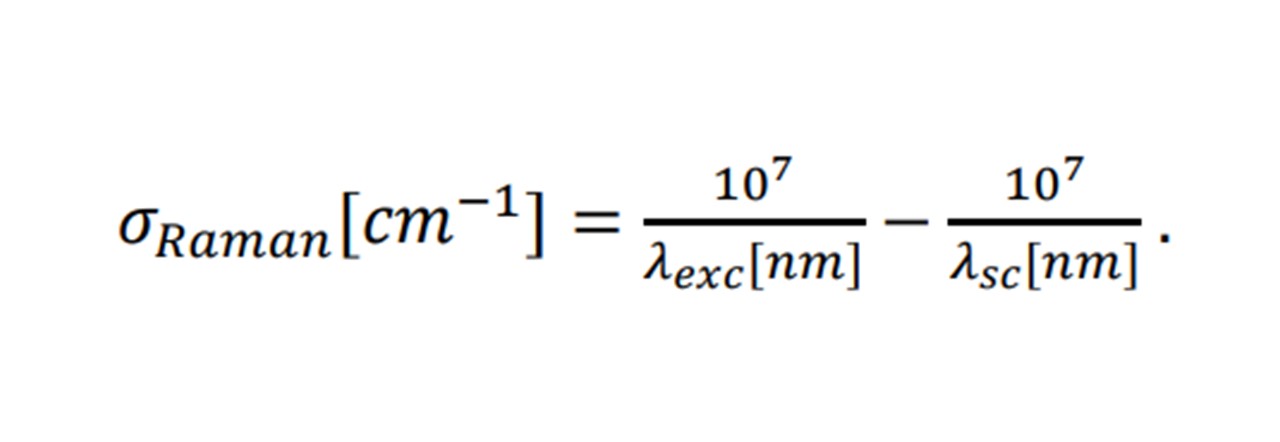
For example, methane’s (CH4) symmetric vibration, when excited by a 500nm laser, would produce scattered isotropic light of 585nm (3 sig. fig.) corresponding to a 2917cm−1 shift, amongst the Rayleigh and other Raman scattered frequencies.
2.2 Background Fluorescence
In Raman spectroscopy, irradiating a substance induces a background fluorescence and is commonly known to make spectra comparisons difficult. Methods have been used to remove this effect. (15)This process is induced by the excitation laser energy closely matching an electronic transition between the ground state and the higher vibrational energies. Once the molecule is raised to a higher energy level, the molecule relaxes to a lower energy and emits fluorescent light. Other forms of fluorescence include emission by transitions between vibrational levels. (12) Despite the limitations imposed by fluorescence to compare between some samples, the presence of this type of emission is actually beneficial for our identification of alcohols. The fluorescence reveals the texture of the sample and so differentiating between multiple alcoholic beverages (all of which have similar concentrations of ethanol) may be done by PCA of the Raman trace (see appendix F : MATLAB Code) or by directly seeing a difference in the spectral trace. We shall see later in Figure 4.2 a display of multiple alcoholic signals showing many levels of fluorescence, allowing us to characterise the whisky samples. This will allow us to create the PCA of our system and develop this device’s classifying abilities.
2.3 Current Developments
A Raman device has been constructed by Ganshang Si et al. (16) Using a 266nm UV laser at 140mW, they constructed a 110mm × 182mm × 47mm device, capable of analysing explosive chemicals.. This result is even more impressive since they were able to detect distinguishable Raman signals for different chemicals at a very low integration time of 15ms. Constructing a low-cost Raman devices has been carried out by N. Emmanuel et al. in India (17), where they focussed on lowering the costs of these devices to make them more accessible for student learning. The portability and easy-use, however, has not been widely investigated; thus this project’s goals, we hope, will be taken further for the construction of future devices. In summary, this thesis aims to:
• Construct a portable Raman spectroscopy device, capable of differentiating various alcoholic beverages.
• Take device capabilities further in the detection of drugs in alcohol.
• Employ PCA methods to create a demonstration of the system for an academic audience.
3 Experimental Design
This chapter overviews the new portable system that we have constructed. Beginning with the constructed layout and the implemented laser safety measures, we move on to discuss the optical apparatus and the process by which each necessary component completes the Raman system.
3.1 Raman Apparatus
As a major goal of this project, a portable Raman spectroscopy device was designed and constructed ( See Figure 3.1). The Raman system was designed to provide maximum laser excitation onto the sample region and thus maximise the number of scattered photons collected onto the optical fibre of the spectrometer. The size was designed to reduce the system’s volume, however this can be further improved through considerations of dimensions, preliminary AUTOCAD design and careful planning of assembling components. The construction optimised the signal for the optics available to us (See appendix A: Component Catalogue). Further alterations to the assembly were done in response to lens calculations (details of the lens calculations may be found in appendix C: Lens Calculations).
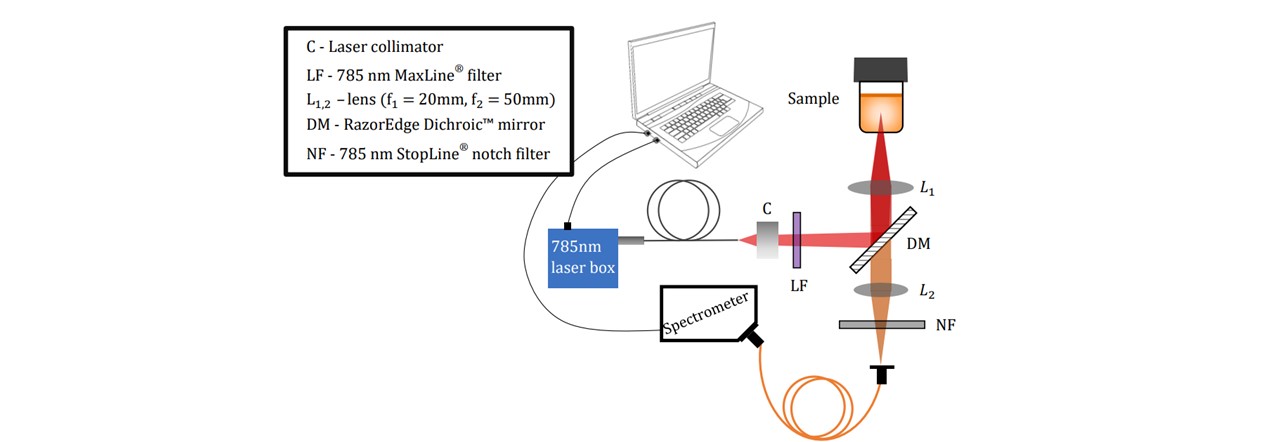
Figure 3.1 : Pictorial representation of the Raman system.
3.2 Apparatus Components
The LuxxMaster® Mini Raman Boxx with 785nm locked wavelength was chosen as an excitation source (See Figure 3.2). The laser beam is passed through a collimator (C) which we shall note here slightly diverges the beam. The lens components were selected based on the initial assumption that the beam was collimated. We have accounted for this divergence in Appendix Beam Collimation Divergence. Adjustments to the lens positions may be done according to modified calculations in appendix C: Lens Calculations. The laser’s monochromatic properties are described in Figure 3.2.
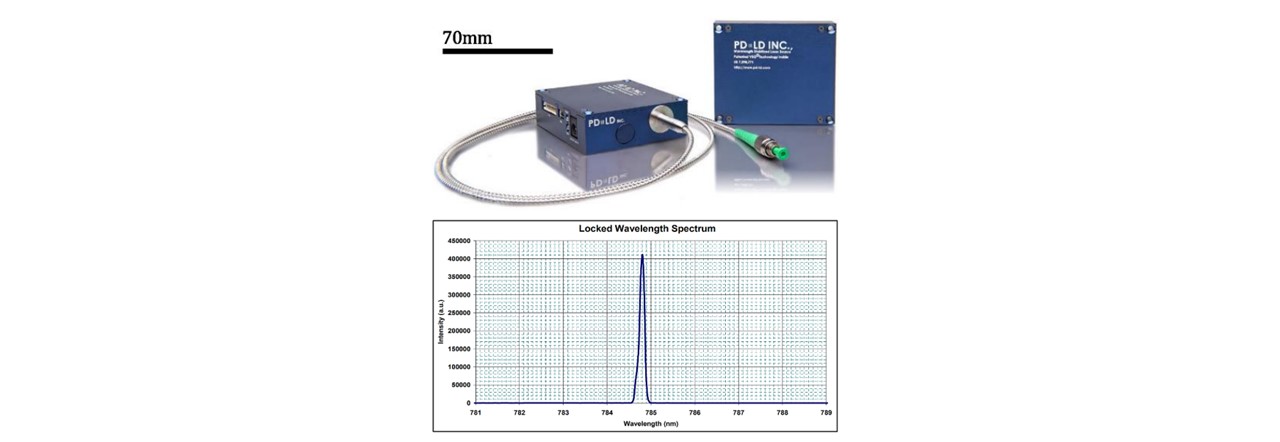
Figure 3.2: (top) Intensity spectrum of laser showing the short deviation of laser wavelength, showing a peak intensity slightly below 785nm, (bottom) Luxxmaster® Mini Raman Boxx with fibre core is a 785nm laser with locked wavelength circuitry ensuring that the monochromatic light enters the system. (41)
The beam is then filtered through a laser-line filter of 785nm (LF), blocking any deviations in the laser’s wavelength or extra transmitting light. Although we are lasing slightly below 785nm, the laser-filter has a typical bandwidth of 3.0nm (See Figure 3.3), thus transmitting the laser beam. The beam is then radiated onto the Dichroic™ Mirror (DM) which reflects the 785nm laser whilst transmitting longer wavelengths associated with the Raman signal. A focussing lens directs the beam to irradiate a homogeneous liquid sample in a 15mm∅ glass vial. This lasing spot lies at around 14mm above the bottom surface of the vial with a diameter of 22μm (see appendix C: Lens Calculations).
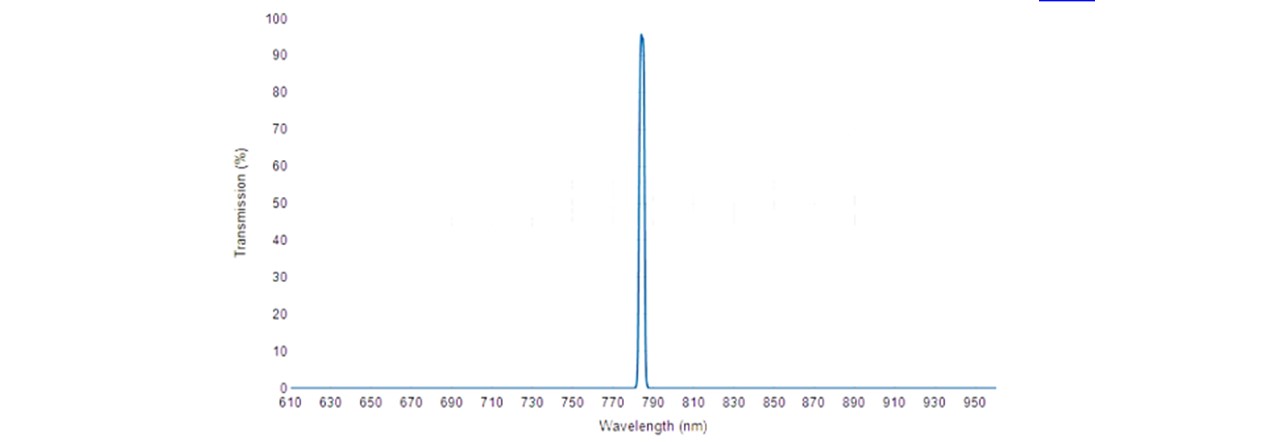
Figure 3.3: Transmission spectrum of 785 nm MaxLine® laser clean-up filter. (18)
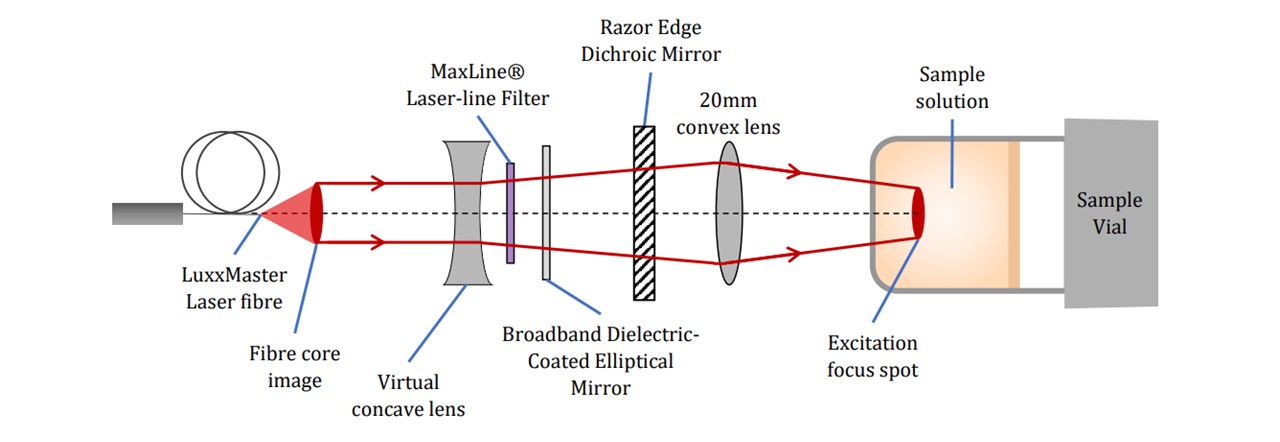
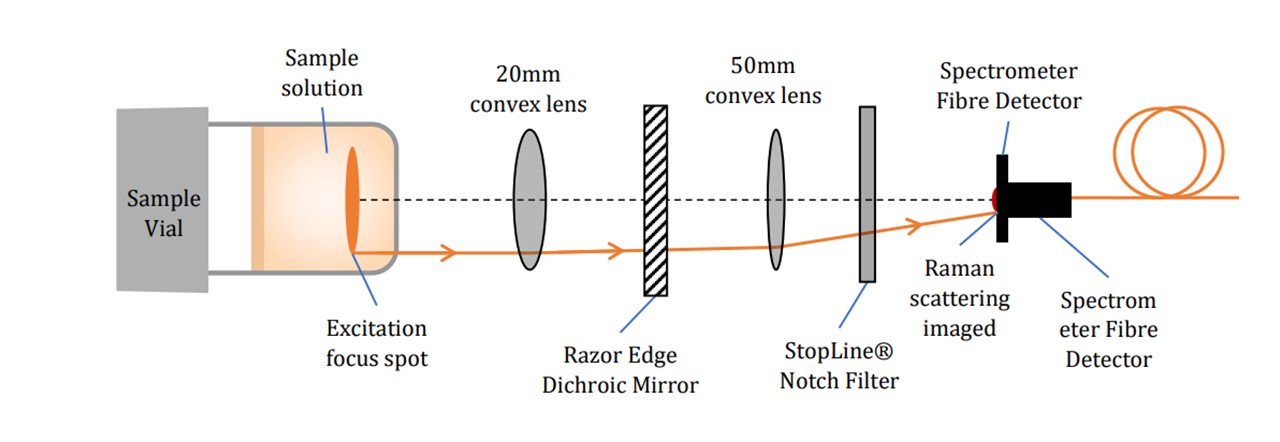
Figure 3.4: Specific pictorial view of key components (not to scale), (top) excitation by the laser beam’s path and (bottom) Raman scattering collection onto the spectrometer.
The laser excites the molecules as explained in the Introduction. Raman scattering as well as Rayleigh scattering takes place. Since Raman scattering occurs isotopically, a Raman signal may be collected below the vial (See Figure 3.4). The scattered light is collimated by the L1 lens. Since the wavelengths of the scattered light is shifted, the light may pass through the Dichroic™ Mirror. The light is then focussed down by another lens L2 through a Notch line filter (NF) onto the spectrometer fibre core. The scattered signal is collected by the spectrometer inlet and sent to the spectrometer and consequently the computer for data processing. The Notch filter blocks 785nm wavelengths, allowing any Rayleigh scattering to be rejected (See Figure 3.5). This would otherwise oversaturate the spectrometer as this is far more intense than Raman scattering, especially since the Rayleigh scattering is maximal along the collection plane (19).
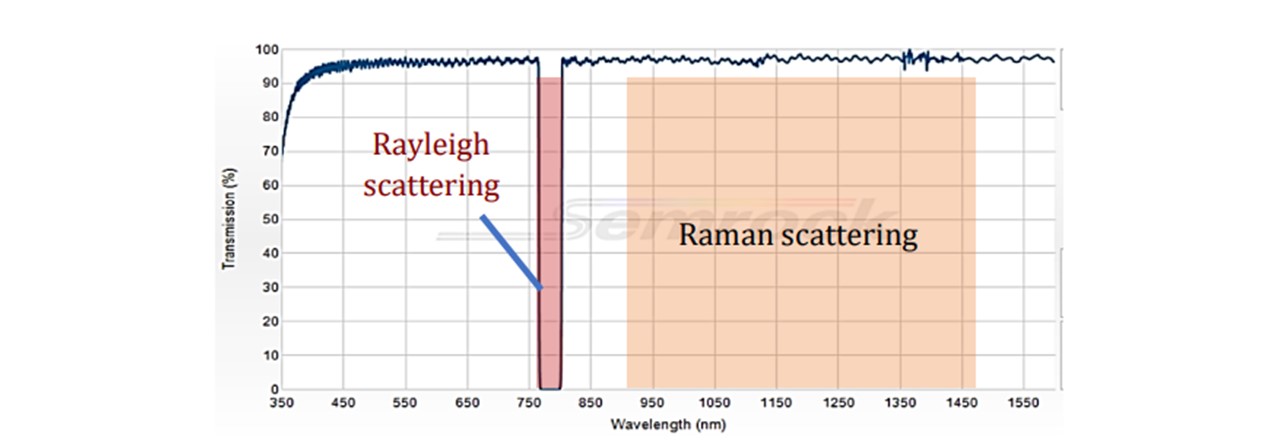
Figure 3.5: Transmission spectrum of 785 nm StopLine® single-notch filter, showing a complete block in the 785nm region and transmission in the other wavelengths.
The spectrometer’s fibre core probe was positioned was to acquire the maximum intensity of the Raman scattered light (Appendix : Spectrometer Detector Placement). The Raman “image” has a diameter of around 45 μm which is small compared to the size of the probe’s inlet of 200 μm, thus maximizing the signal as the majority of photons will enter in this region. A further blocking of the 785nm Rayleigh signal is built into the Maya2000 Pro Spectrometer (Figure 3.6).
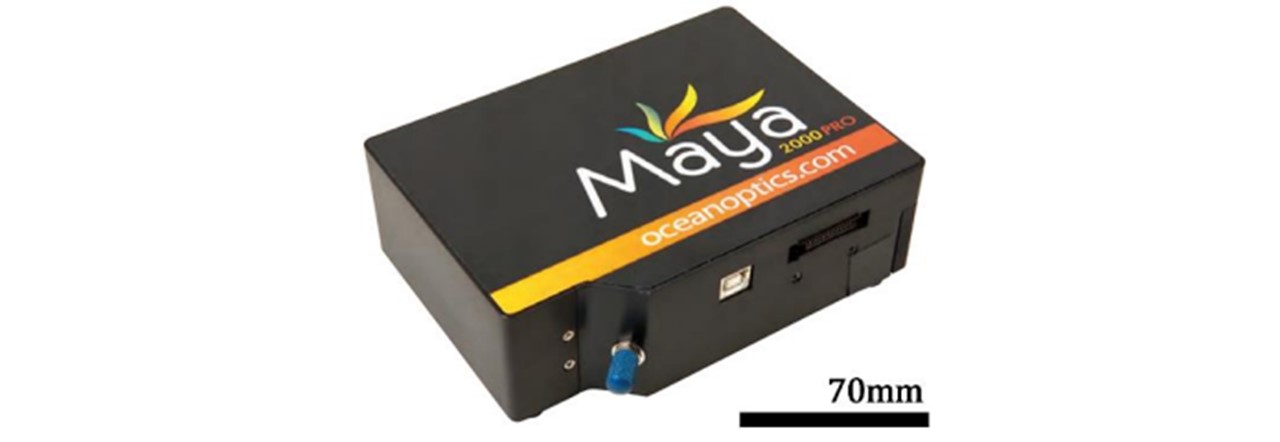
Figure 3.6: Maya2000 Pro® spectrometer, taken from Ocean Optics instruction and specifications manual. (20)
3.3 General Methods in Spectrum Acquisition
Spectrums were initially viewed in Ocean Optics’ Overture© which is able to set parameters such as integration time, averages and pixel smoothing (see appendix D: Spectroscopy Viewing). As the software views spectrums in wavelength (nm), all spectrums were converted to Raman Shift via Equation 2.1. Background traces were taken by lasing an empty vial, accounting for any fluorescence in the glass. The intensities were subtracted across all wavelengths to acquire a corrected spectrum. The acquisition procedure may be operated by MATLAB code for a demonstrational approach, although most of the data processing was done in Microsoft Excel (See Figure 3.7).
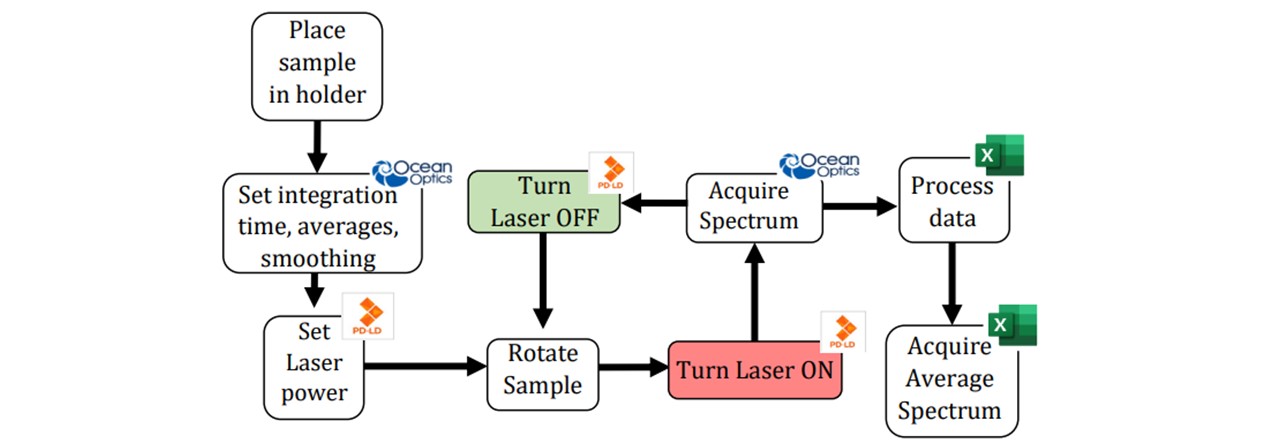
Figure 3.7: Flowchart of acquiring a spectrum, including the software used to control the laser (Mini Raman Boxx Control Panel), take spectrums (Ocean Optic’s Overture) and analyse the data (Microsoft Excel). All of these processes may be done together in MATLAB without the need for clicking back and forth between windows. See appendix F: MATLAB Code for the full details of how this process can be combined for a demonstration.
Samples were taken directly from the whisky bottles and labelled accordingly. Using a syringe, 2 ml will be required to cover the region in the vial where the laser is focussed to its maximum intensity, 14mm above the bottom of the vial (See appendix G: The Sample). For preparing a specific sample see appendix H: Preparing Samples. A Dielectric Elliptical Mirror (not included in system diagram) may also be adjusted to steer the beam across the fibre collection of the spectrometer in order to provide a maximum Raman intensity. A solution of isopropanol (IPA) was used as a test sample to align the mirror as this is very Raman active. Overture© was used to view a maximum signal for a correctly calibrated mirror alignment. When acquiring a Raman trace of a sample, it is worth noting that imperfections in the vial’s glass bottom may alter the signal’s consistency. Rotating the glass vial across many angles and acquiring an average will minimise this error in sampling. We shall mention here that lasing at higher powers of 500mW was observed to heat the sample and so this power must only be used for specific cases since it could photodegrade the substance if left for long periods of time).
3.4 Laser Power effects on Spectrum
With the laser-diode operating at various powers to optimise the system, it is worth confirming the linear dependence of the spectrum’s intensity with increasing laser power. A vial of IPA was inserted into the sample holder and the laser power was increased from 20mW to 300mW in steps of 20mW. A spectral background was taken by inserting an empty vial and having the laser switched off (see Figure 3.8).
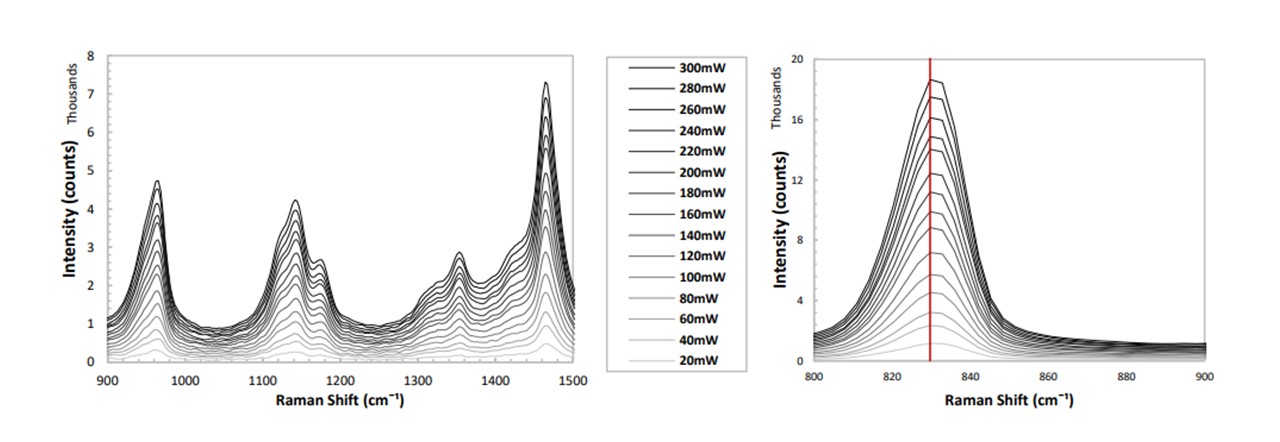
Figure 3.8: (left) Spectrum of IPA for varying diode laser powers, (right) zooming in on the 830cm−1 mode.
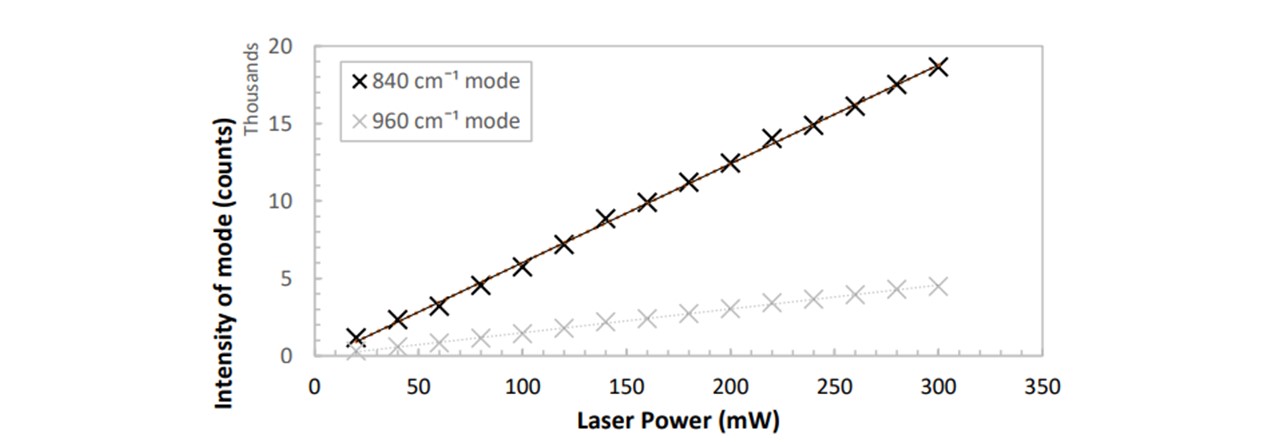
Figure 3.9: A clear linear dependence between spectrum intensity and diode laser power. An additional mode of 960cm−1 was investigated to confirm this linearity.
Since the resulting spectrum’s peak intensity is linearly proportional to the laser power (see Figure 3.9), when we later normalise our spectrums around a specific mode in Detecting Drug Traces, this normalisation may be done by a simple ratio multiplication. As we are changing the laser power throughout the assembly, optimising the laser power is necessary to achieve a visible trace with a higher power whilst preventing photodegradation of the samples with a lower power. Since the number of Raman photons is proportional to the number of molecules of that specific molecular vibration, we shall also see in Detecting Drug Traces that the concentration of a substance is linearly proportional to the peak height corresponding to its specific modal vibration.
4 Whisky Classification
Here we showcase the devices capabilities in producing spectrums of varying whisky brands and ages.
4.1 Testing Sample: Ethanol
We carried out an additional verification of system’s performance by comparing a spectrum acquired from ethanol to the expected theoretical spectrum. We have compared our Raman trace to a theoretically calculated set by Peter J. Berryman and David A. Faux (21). As whisky usually contains 40% ethanol, it will be good to verify that these ethanol peaks are visible and precise.
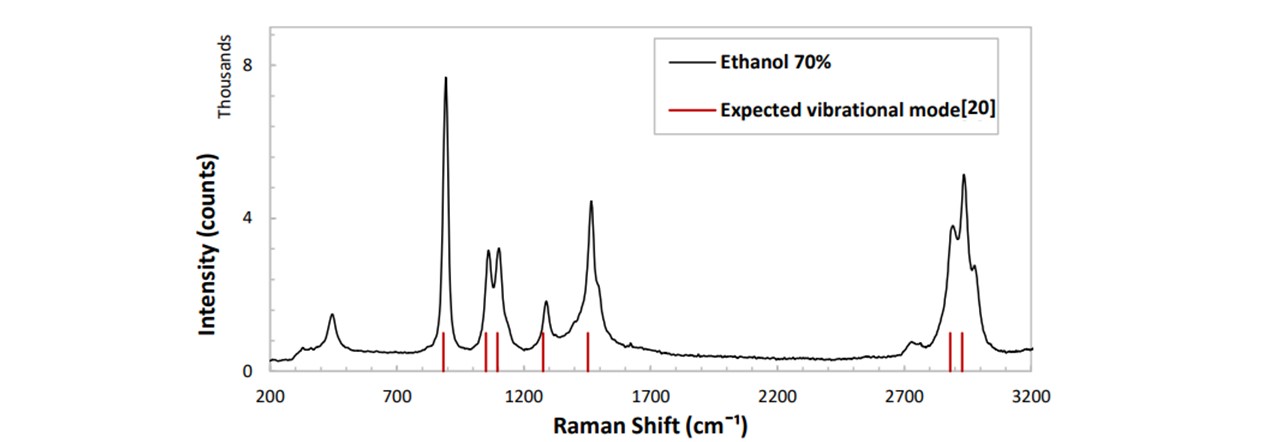
Figure 4 Expected vibrational mode[ ] .1: Raman trace of ethanol (40%) with the theoretically expected modes (red) (21),
These are promising results. The values for Raman modes lie close to the values obtained by Peter J Berry et al, confirming that our system has a wavelength aligned correctly. When analysing alcoholic beverages such as whisky, the signal of ethanol is expected to appear as well as any fluorescence due to the texture of the beverage. See appendix D: Spectroscopy Viewing for additional Raman traces of a variety of samples, including cooking oils, urine and SKITTLES ®.
4.2 Characterising Whisky Brand
Alcoholic beverages such as whisky contain concentrations of ethanol (~40%). The importance of classifying whiskies is vital for detecting fraudulent brands which attempt to mimic the original brand’s authenticity. The major difference between each whisky sample is the background fluorescence, which will be used to characterise our whiskies. These were acquired from various sourced by the St Andrews University Optical Manipulation Group. Their Raman traces was taken with a power of 300mW, integration time of 2s and a pixel smoothing of 1 with 6 averages for each trace (see Figure 4.2). The characteristic components of ethanol are observed clearly in each sample, where the intensity of the peaks (from the fluorescence level) correlate linearly with the ethanolic concentration
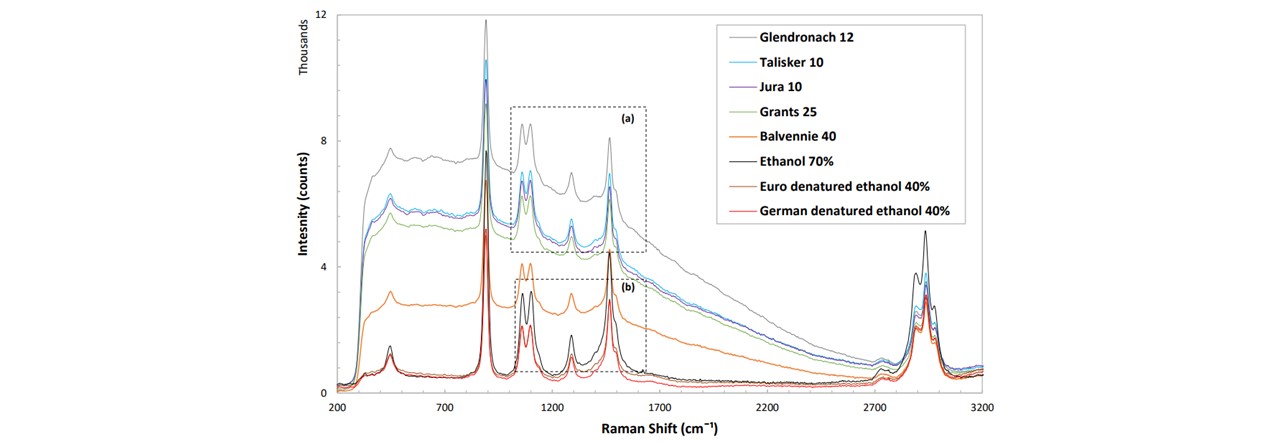
Figure 4.2: (top) Raman spectrum for a variety of different whisky brands, clearly showing differing fluorescence levels. Comparing with ethanol (black), we can see that these peaks are strongly ethanolic. (a, b) Zooming in on areas where the traces are very similar, the device is able to differentiate between alcohols of very similar methods, namely (see (b)) the Euro method denatured ethanol (dark red) and the German method denatured ethanol (red).
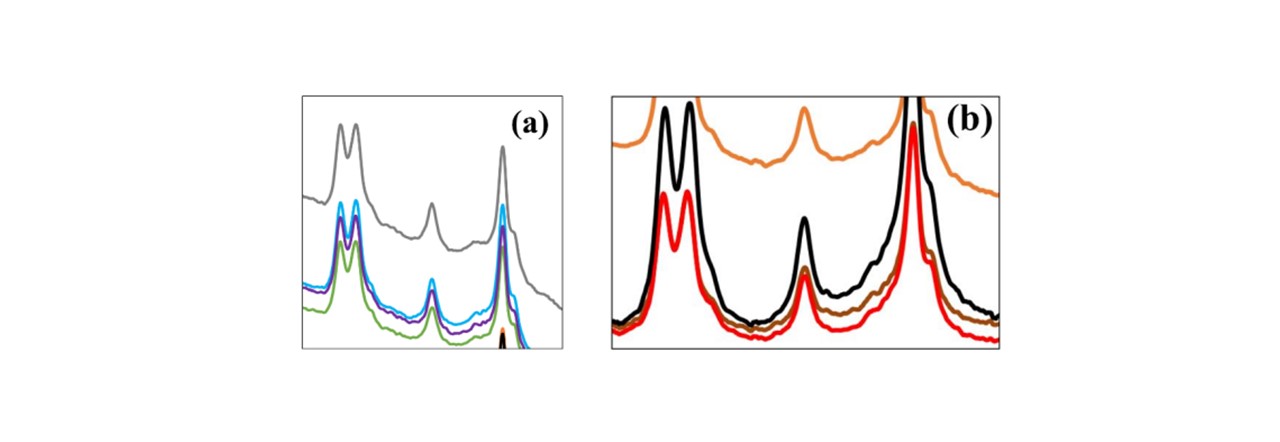
Figure 4.3: Further analysis of another alcoholic type, namely Cognac, shows a larger increase in the fluorescent background. Note the larger ethanol peak intensity for Ethanol 70% compared to that of Glendronach 12 (40%)
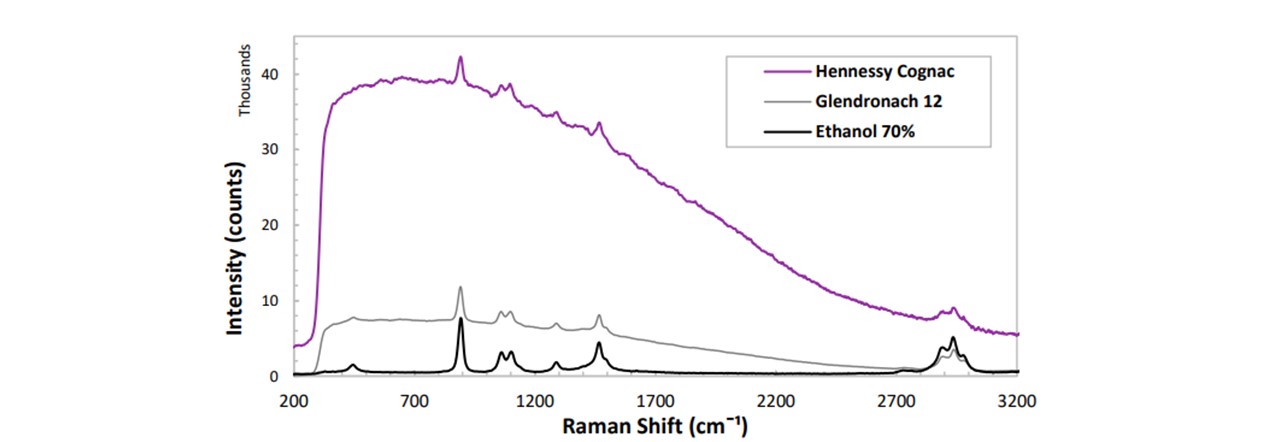
The various brands of whisky display their distinct RS trace. The high resolution of our spectrometer allows us to differentiate similar whiskies, such as Jura 10, Talisker 10 and Grants 25. The peaks indeed correspond to the ethanol and are lower in intensity than 100% ethanol, corresponding to a reduction in concentration (~40%). Another alcoholic variety, namely Cognac (Figure 4.3), displays a different fluorescence from the lower whisky traces. Therefore, this can be assigned its own category when differentiating alcoholic substances.
4.3 Characterising Whisky Age
As whiskies age, their textures and taste also changes (22). Since the alcohol concentration is quoted to stay constant throughout the aging process, a changing fluorescence is expected. There appeared to be no clear correlations in the years of the whisky and it’s progression over time. Glenfiddich 12, 15, 18, and 21 years were analysed.
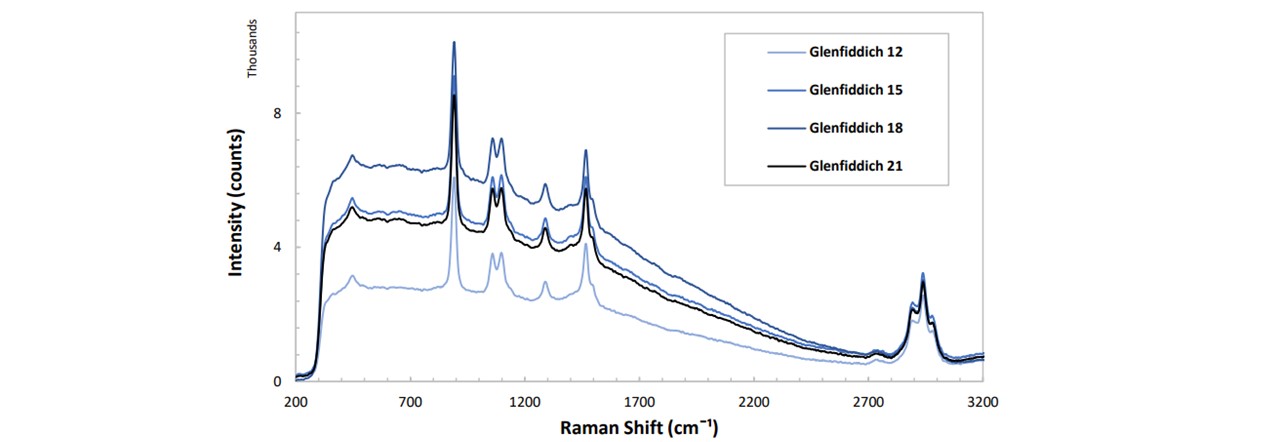
Figure 4.4: Spectrums of Glenfiddich whisky at various ages. The function to which the fluorescence changes with time is not able to be fully concluded since the resolution of time is far too low. It would be better to obtain more samples of Glenfiddich in age steps of 1 year, including whisky samples of ages less than 12 years in order to fully see how the fluorescence level changes over time. However, we are able to classify the different whisky years, even for whisky traces which lie close together, such as Glenfiddich 21 and Glenfiddich 15.
5 Detecting Drug Traces
In a separate line of enquiry, we chose to test the performance of the portable device in detecting small quantities of drugs concealed in liquids. This has potential applications in combatting criminal activity, both in the contexts of professional sports (Performing Enhancing Drugs) and in the detection of date-rape drugs in alcoholic beverages. Paracetamol was spiked into 99.75% ethanol as well as Glenfiddich 12 whisky in varying concentrations. See appendix H: Preparing Samples. Initial spectrums of high paracetamol concentrations were added to ethanol and whisky and spectrums were taken to demonstrate the peak deviations are indeed due to paracetamol. A paracetamol tablet was positioned using white tape in the sample holder, where the surface of the tablet was positioned at the focal point of the laser beam (laser goggles must be worn in this case as one must adjust the tablet whilst reading for a maximum Raman signal). All spectrums were acquired with a 500mW laser power, and a 2s integration time. Although paracetamol was used in spiking, the same system could be applied to any drug.
5.1 Paracetamol in Ethanol
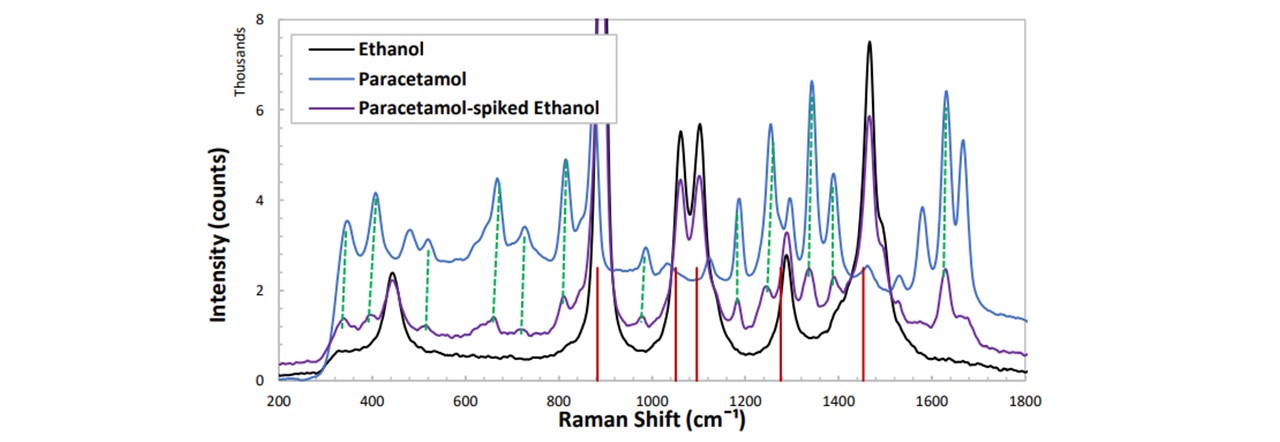
Figure 5.1: (red vertical lines) Ethanol vibrational modes correspond to the intense peaks in the spectrum, (dashed-green lines) the emerging peaks seen in the spiked spectrum indeed correspond to paracetamol.
After confirming the paracetamol peak’s emergence in Figure 5.1, in order to compare the spectrums of multiple concentrations of paracetamol, as well as an assumed constant ethanol concentration, we must apply a normalization to the spectra such that the ethanol peaks show no change whereas there is change in paracetamol. Notice that the 870 cm−1 mode of paracetamol is saturated by the 883 cm−1 mode of ethanol. This prevents any paracetamol peak heights to be investigated in this region. Furthermore, determining peak heights of paracetamol may be done with modes such as 1333 cm−1 as some are out-with the vibrations of ethanol and are very intense. With increasing concentration of paracetamol, by reasons noted in appendix H:_Preparing_Samples, we observed a decrease in the overall intensity of the spectrum. Each trace was normalised about the 1467 cm−1 mode of ethanol and the heights of each peak were plotted as a function of the paracetamol concentration. This peak was chosen as this lies away from any paracetamol modes. The peak heights were determined manually, see appendix I: Analysis Methods.
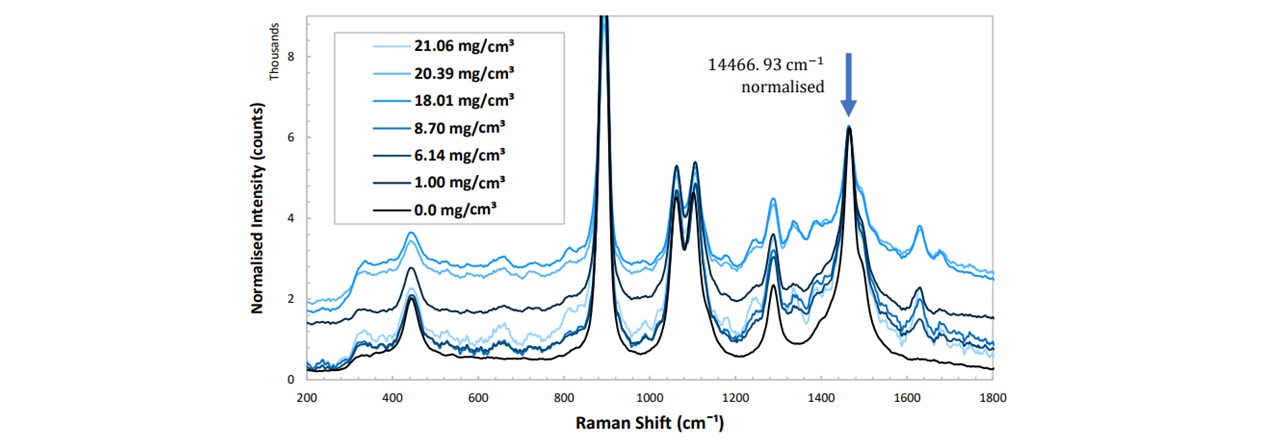
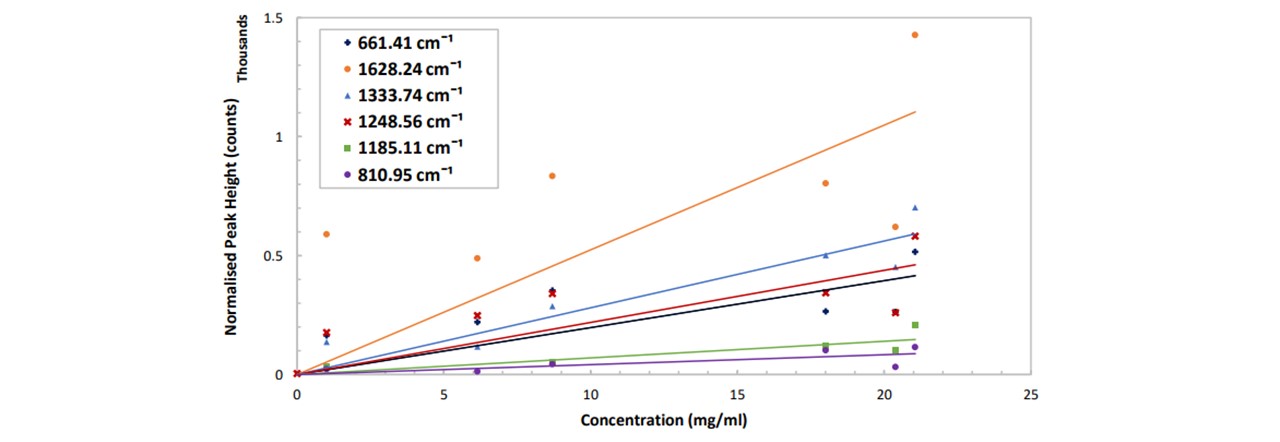
Figure 5.2: (top) Normalised spectrums in pure ethanol at varying concentrations of paracetamol, (bottom) peak height as a function of paracetamol concentration for different vibrational modes of paracetamol. See appendix K: Spectral Results for functions of these trendlines. The errors are ±3.6 mg/ml and ±8 counts for the concentration and the normalised peak height respectively.
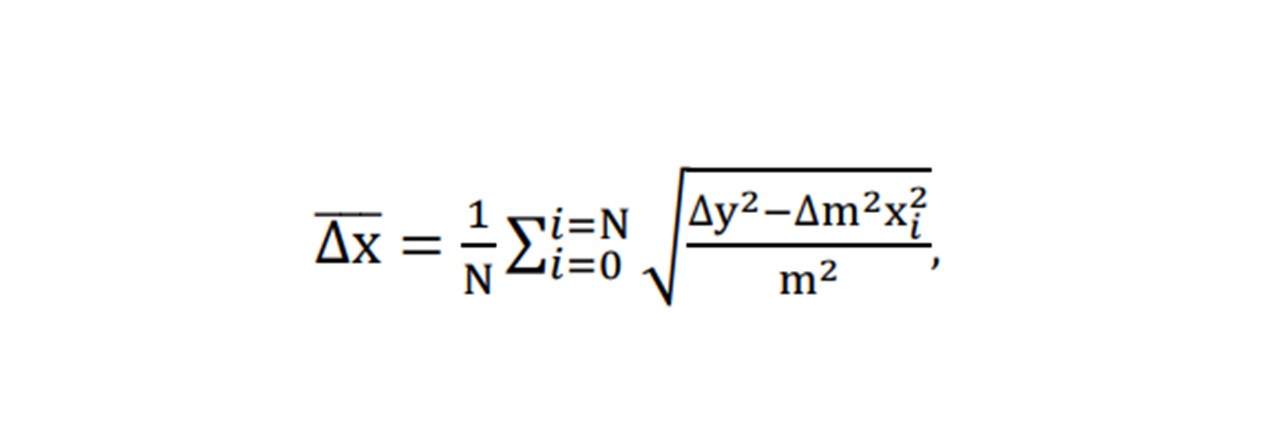
Each mode displays a linear increase with paracetamol concentration, with 1628cm-1 showing the largest gradient and 810cm-1 being the smallest (Figure 5.2). However, the larger the gradient of the slope (i.e. measuring modes of larger peaks) results in a larger uncertainty in the concentration. Errors in the concentration number may be due to ethanol lost from vial by evaporation: it was observed that the weight decreased over the time when the vial was opened and left on the balance. (Extracting the ethanol with the pipette caused many errors including the imprecise extraction of 6ml of ethanol: the pipette was 1ml large, so doing this 6 times would result in additional errors). For this system, by considering the respective uncertainty in the concentration at each concentration, the average smallest possible detectable change in paracetamol concentration is given by:
5.2 Paracetamol in Whisky
Further to our ethanol investigations, detecting paracetamol in samples of whisky may also be applied. However, the methods of preparing a sample has changed. Namely, employing a mass-ratio instead of a concentration scale (See Equation 5.2)
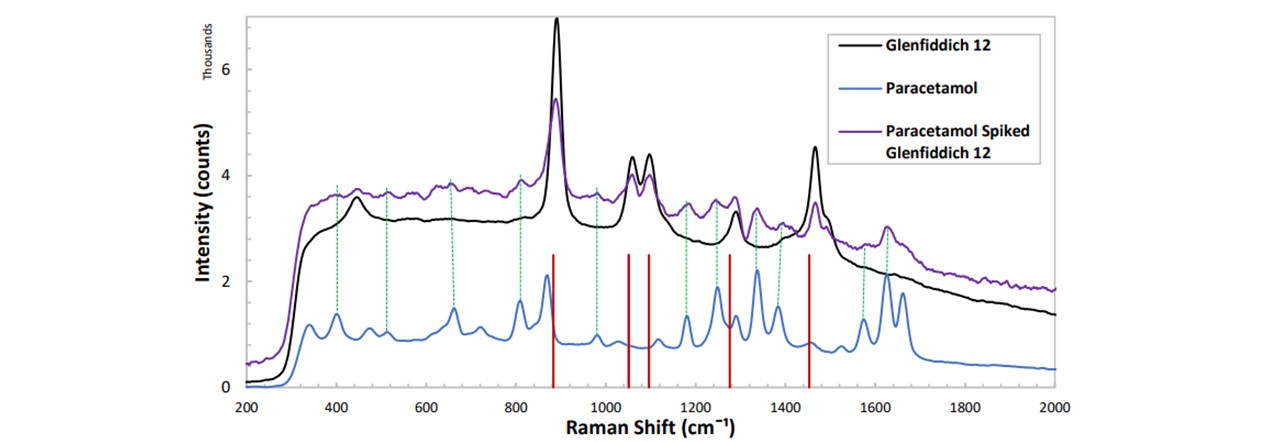
Figure 5.3: Spectrums of Glenfiddich 12, paracetamol as well as paracetamol-spiked whisky. Large peaks correspond to the usual ethanol modes (red lines). Peaks in the spiking trace correspond to that of paracetamol (green-dotted lines), thus confirming that paracetamol has been detected in whisky
To investigate adding paracetamol to whisky at varying concentrations, an alternative method to that used in ethanol sampling was used to create a concentration scale. The methods of calculating the concentration of paracetamol in whisky yielded ‘negative concentrations’ if applying similar methods to that used for ethanol (See appendix H: Preparing Samples). For this case, we can no longer assume there is no reaction taking place within the combination of whisky and paracetamol. Instead, a more general term, MR, may be used as a value of concentration. MR being a ratio of masses of the whisky and ethanol.
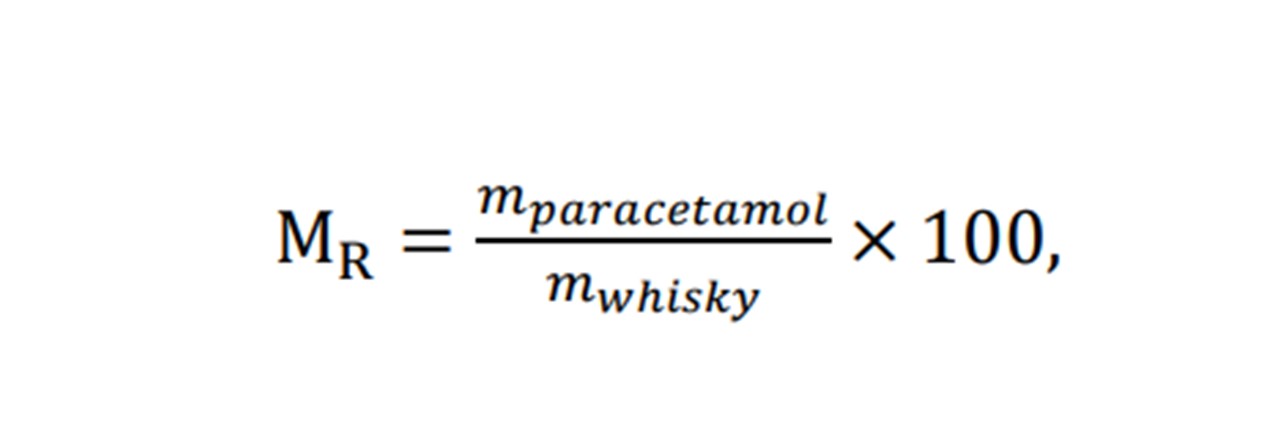
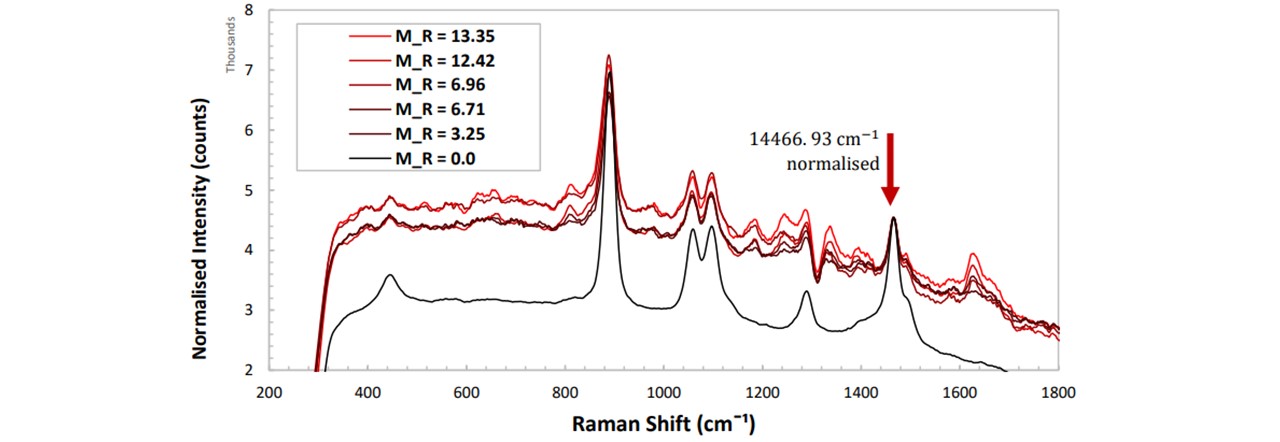
Figure 5.4a: Normalised spectrums of paracetamol in Glenfiddich 12 whisky at varying concentrations of paracetamol.
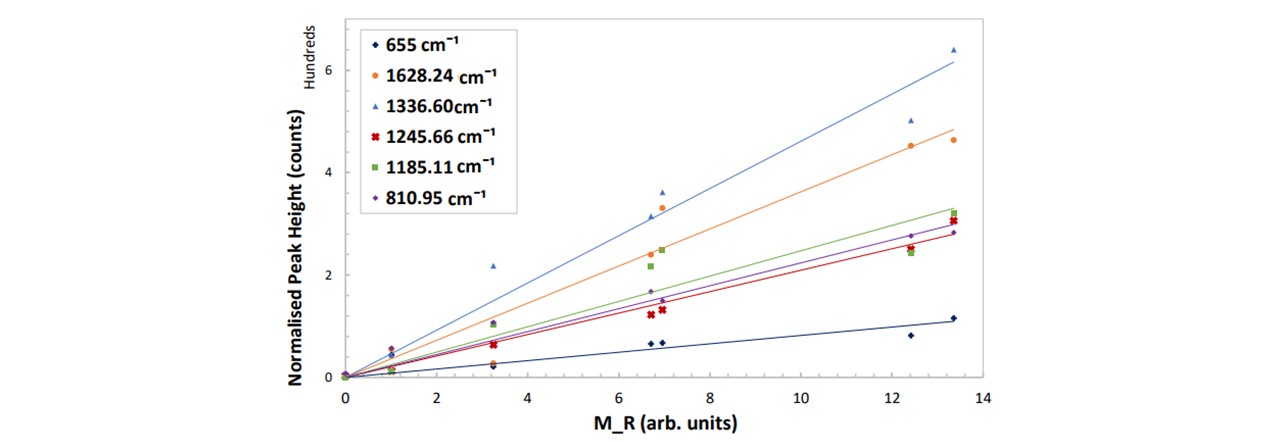
Figure 5.4b : Peak height as a function of M𝑅 for different vibrational modes of paracetamol. The errors are ±0.009 mg/ml and ±8 counts for the concentration and the normalised peak height respectively. See appendix K: Spectral Results for the functions of these trendlines with their relative uncertainty.
Similar to Paracetamol in Ethanol, these findings reveal the linear dependence of the normalised peak intensities with the mass ratio. From this, we will be able to determine the amount of the drug within the drink by measuring the resulting normalised peak intensity of an unknown sample. The 1336cm−1 mode is a good peak to measure as this has the largest gradient and so will extend beyond the ±8 counts in the minimal region. Likewise, based on Equation 5.1, the average smallest possible value which this system can detect a recognisable change in concentration is given by:
∆̅̅x̅ = ±0.19 arb. units , equivalent to 0.19% of the overall mass of the drink. The general consensus amongst health professionals is that mixing both alcohol and any dose of paracetamol is harmful to the liver and can cause nausea, sickness, vomiting and lack of coordination (23). Moreover, there isn’t a clear consensus amongst the literature as to the lowest dosage of ethanol-paracetamol leading to symptoms. This makes it tricky to compare our results and test our system to whether we can detect this minimal dosage. However, we can demonstrate what M𝑅 value for a scenario and see whether we may predict a noticeable difference in the peak heights based on our model. For a 50 ml glass of Glenfiddich 12 whisky, a single paracetamol tablet in this drink would result in M𝑅 = 1.09. This would cause an increase in the normalised peak height by the values noted here.
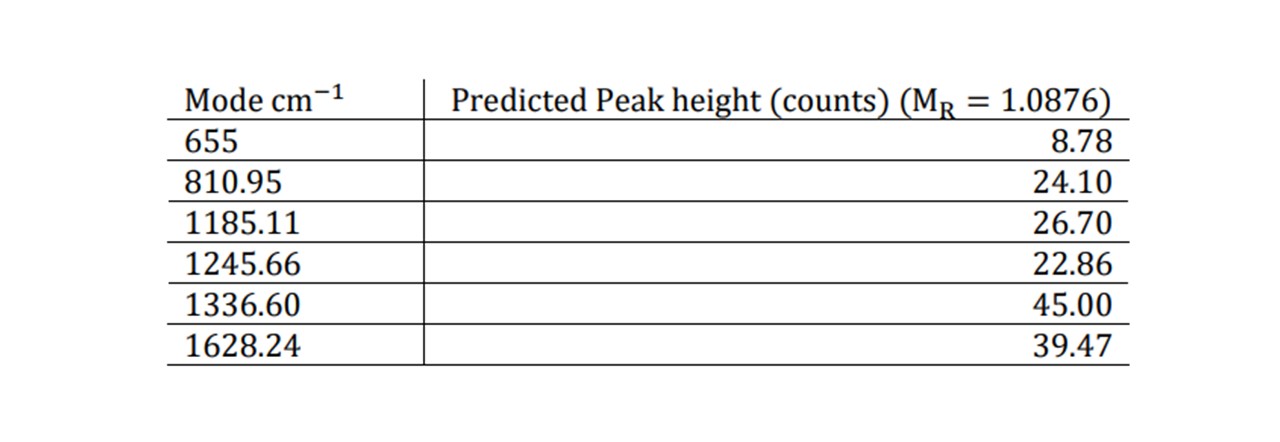
Table 1: Raman modes of paracetamol and corresponding peak heights display
Although very small compared to the concentrations seen before, a noticeable difference may be observed, especially for the 655cm−1 mode which still predicts an observed peak which is greater than the uncertainty of ± 8 counts. Furthermore, as more paracetamol is added, the substance’s chemistry changes, changing the refractive index (and thus the focal position). The substance may also become more absorbing resulting in a decrease in the overall spectral intensity, including the level of fluorescence. For unnormalized traces at very small doses the spectrum’s change may be detected (see Figure 5.5).
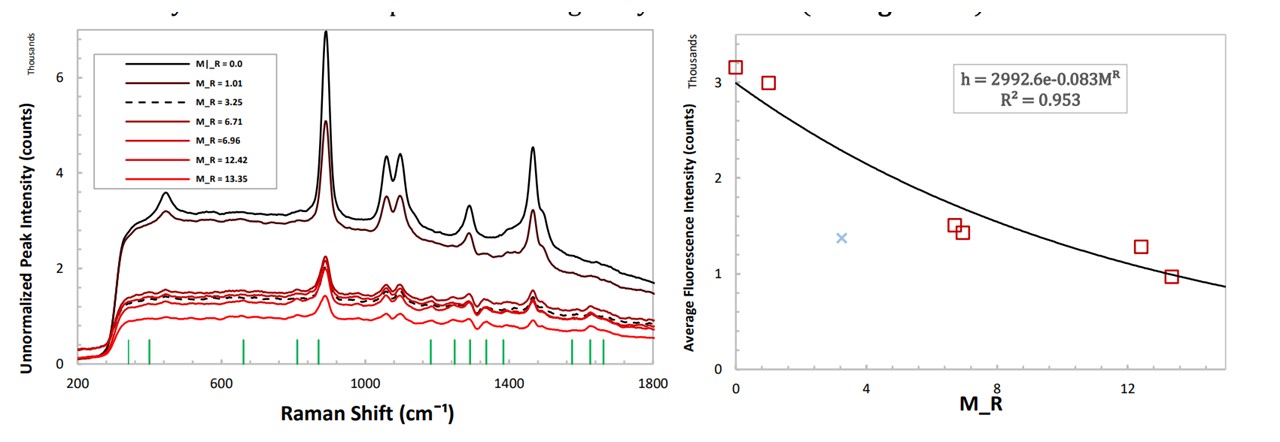
Figure 5.5: (left) unnormalized spectrums of paracetamol in Glenfiddich 12 whisky, (right) height of fluorescence in the 500 cm−1 to 800 cm−1 region showing an exponential decay.
For unnormalized spectrums of different doses of paracetamol, the average height of the fluorescence was determined (Figure 5.5) (See Analysis Methods : Fluorescence Method). The level of fluorescence decays exponentially with higher doses of paracetamol, caused by the sample absorbing the laser instead of inducing Raman scattering. Thus the system is more sensitive to detect smaller doses of spiking. For an unknown low dose, it may be able to suggest whether spiking has taken place, but is less accurate in determining which drug was used in the spiking process due to the small heights of the resulting peaks above the fluorescence level. The method of normalising the ethanol peaks would be able to accomplish this as established in Figure 5.4a. Identifying the drug used would require higher doses to display the characteristic peaks, thus lowering the fluorescence level further, however, it is less accurate in determining it’s concentration (M𝑅) at this higher level. Thus, there is a trade-off between determining the drug and the concentration of the drug in a set of unnormalized spectrums using this method.
6 Public Demonstration
In this chapter, we review the necessary procedures of the device’s hardware and software in order to provide a safe as well as impressive demonstration.
6.1 Hardware
When presenting to the public, outside the controlled lab environment, laser safety must be a first priority. The LuxxMaster® laser emits Class IV radiation and eye protection was worn throughout the construction and alignment (See appendix L: Laboratory). Since the 785nm laser light is deflected upwards to concentrate on the sample, when no sample is placed in the holder and the laser is switched on, there is a significant danger to radiation being aimed at the user if no cover is installed. A portable interlock system was fitted to cut the laser if the beam outlet is directly exposed to the environment. Christopher Booth in the Electronics Department was able to design and fit a 12V interlock system into our LuxxMaster® Mini Raman Boxx with pressure switches controlled by the lid of the enclosure (see Figure 6.1). When the lid is raised off at least one of the pressure switches, the interlock is disconnected, signalling the laser to turn off. Once the lid is on both switches, the laser may be switched on and controlled.
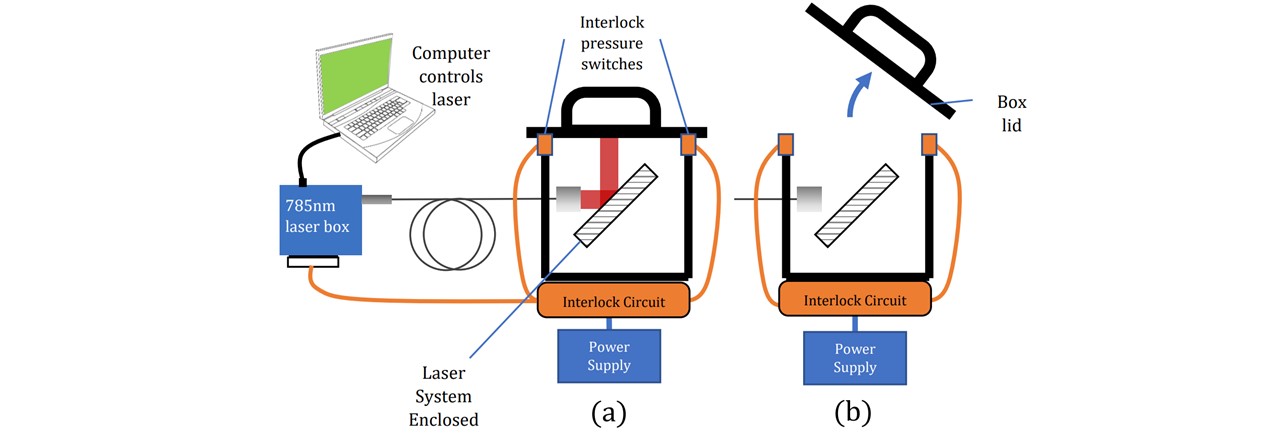
Figure 6.1 : (a) Interlock system allows laser to operate when switches are pressed. (b) Once released, the signal is cut and no laser power may be allowed.
Initially, the interlock was connected to an in-lab power supply. At later stages, the power supply was modified to allow the device to be connected to any standard mains.
The system was made portable by rewiring the interlock system cables, and carried to a noisy, busy and public environment. On demonstrating the sample acquisition, MATLAB was used to both control the laser and acquire data for processing a PCA in order to identify the sample. We base our identification on a training data set acquired earlier. Since the apparatus was moved, the system needed to be re-trained before the demonstration. This took around 30 minutes for a set of 16 samples. The system was able to classify all the samples correctly, even samples which have almost identical spectrums, namely the German and Euro ethanol (Figure 4.2 (b)).
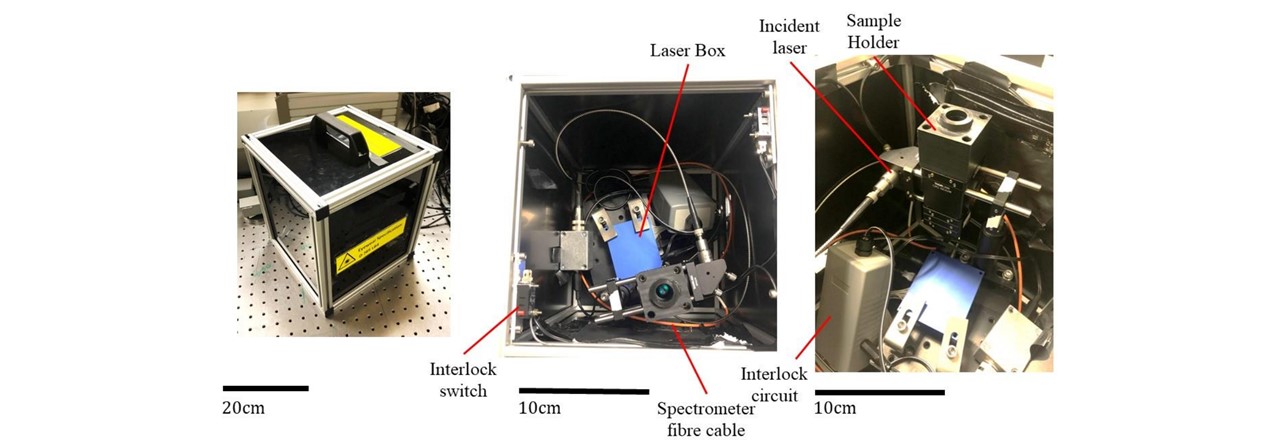
Figure 6.2: (left) fully enclosed device with secured lid, (middle) top view of connected system, (right) further image of inside details of key components.
6.2 Software
The MATLAB program (Whisky GUI) designed by Dr Mingzhou Chen compares an unknown spectrum to a set of known spectrums (See Figure 6.3). The PCA function in MATLAB may group each whisky sample according to their PCs and when an unknown sample’s PCs are analysed, the PC group to which it lies closest to may be assigned to the sample. Thus the substance may be identified and classified to that group. See appendix F.2: System Training for a general demonstration of the GUI as well as appendix F.1: MATLAB Code for a breakdown of the GUI
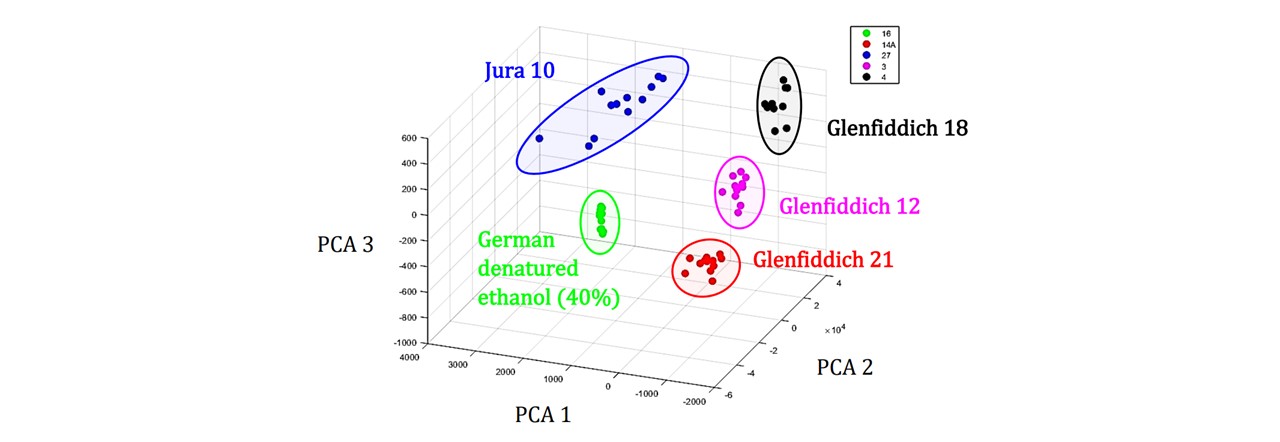
Figure 6.3: PCA cluster plot of whisky variety. Each cluster group has distinct PCA values and an unknown sample may be assigned to one of these groups and the sample may be identified based on the region in which it’s PCs are located. Examples showing Jura 10 (blue), Glenfiddich 18 (black), Glenfiddich 12 (magenta), Glenfiddich 21 (red), German denatured ethanol (40%) (green).
Many students and academic staff were very impressed by the system and asked enthusiastic questions on the design process, operations and future applications within the project. For further images of demonstrating the device: see appendix B: Figure B.2.
7 Conclusion
Constructing a Raman system for food and beverage analysis has been completed. Through rigorous engineering and designing, we have been able to construct a Raman system. Assembling and designing decisions were inputted by preliminary investigations such as Beam Divergence, Detector Placement, Lens Calculations as well as assembling the device within the constraints imposed by the components and housing dimensions. Additionally, the system was able to precisely produce Raman signatures of ethanol comparable to that of theoretically predicted values. The device was also proficient in displaying signature Raman spectrums of various whiskies, and discriminate between similar whisky brands. We have also been able to show different spectral traces in a range of settings in appendix D: Spectroscopy Viewing. Furthermore, our device was able to detect drugs which were concealed within ethanol at concentrations as low as 0.8mg/ml as well as in whisky at a remarkably low 0.19% of the total drink’s mass. A model of predicting the spiking concentration was achieved and employed for a general scenario. By employing a new mass-ratio variable, MR, we were capable of creating a predictable concentration scale for a specific height of a normalised whisky peaks. However, the methodology of calculating the concentration of paracetamol in whisky needs to be revise. Although the MR provides an accurate description against the peak heights, it will however be redundant when communicating to health professionals as to specific values (in mg/ml) of spiking, especially with a variety of whiskies and alcohols having varying densities. It would be interesting to investigate if this method may also be applied to other whiskies and alcoholic substances. If so, future devices and programs may be designed to calculate the concentration of an unwanted substance hidden within a known chemical. Likewise, for unnormalized traces, we were able to determine whether a whisky drink has been spiked at markedly low doses, predominantly based on the large decrease in the fluorescence from the normal trace. Other drugs should also be investigated to see whether the trace shows the same behaviour unanimously for all dissolving drugs, or whether specific drugs, such as those with a particular pigment, display a unique spectral change. Once fully enclosed, we established the MATLAB code to interface with the system to operate via the laser and the spectrometer drivers, which would previously operate manually through multiple applications. The MATLAB Whisky GUI successfully stored and implemented a training data set of 15 whisky and chemical samples. We carried out a PCA of an unknown sample and impressively identified the spectrum based on our large training data set of 15 spectra per sample . Albeit training the system took some time (about 5 retrains on one substance before it was successfully identified), the system was prepared to be presented to a public audience. Laser safety was a major priority and we have successful built a functioning interlock enclosure which allows the Raman system to be used safely and securely. The device was able to classify the 15 different samples of whisky with the GUI at 200mW for an integration time of 1s. Moving, nudging or shifting the enclosure may require retraining depending on how similar the samples are. Investments in making the device more robust and flexible to changing the location should be made if such devices are to be used portably. To improve against multiple sets, a PCA could be carried out giving an output value (%) of how close the analysed spectrum is to specific PCs. There are a lot of applications to be brought forward with these results. Particularly, detecting drugs or substances concealed within another substance. This may lead to further solutions in investigating date-rape drugs and doping in competitive sports. With contributions from this thesis as well as other developments in portability and easy-use (17), (16), we hope that future devices may provide security and safety in the food and drink industry
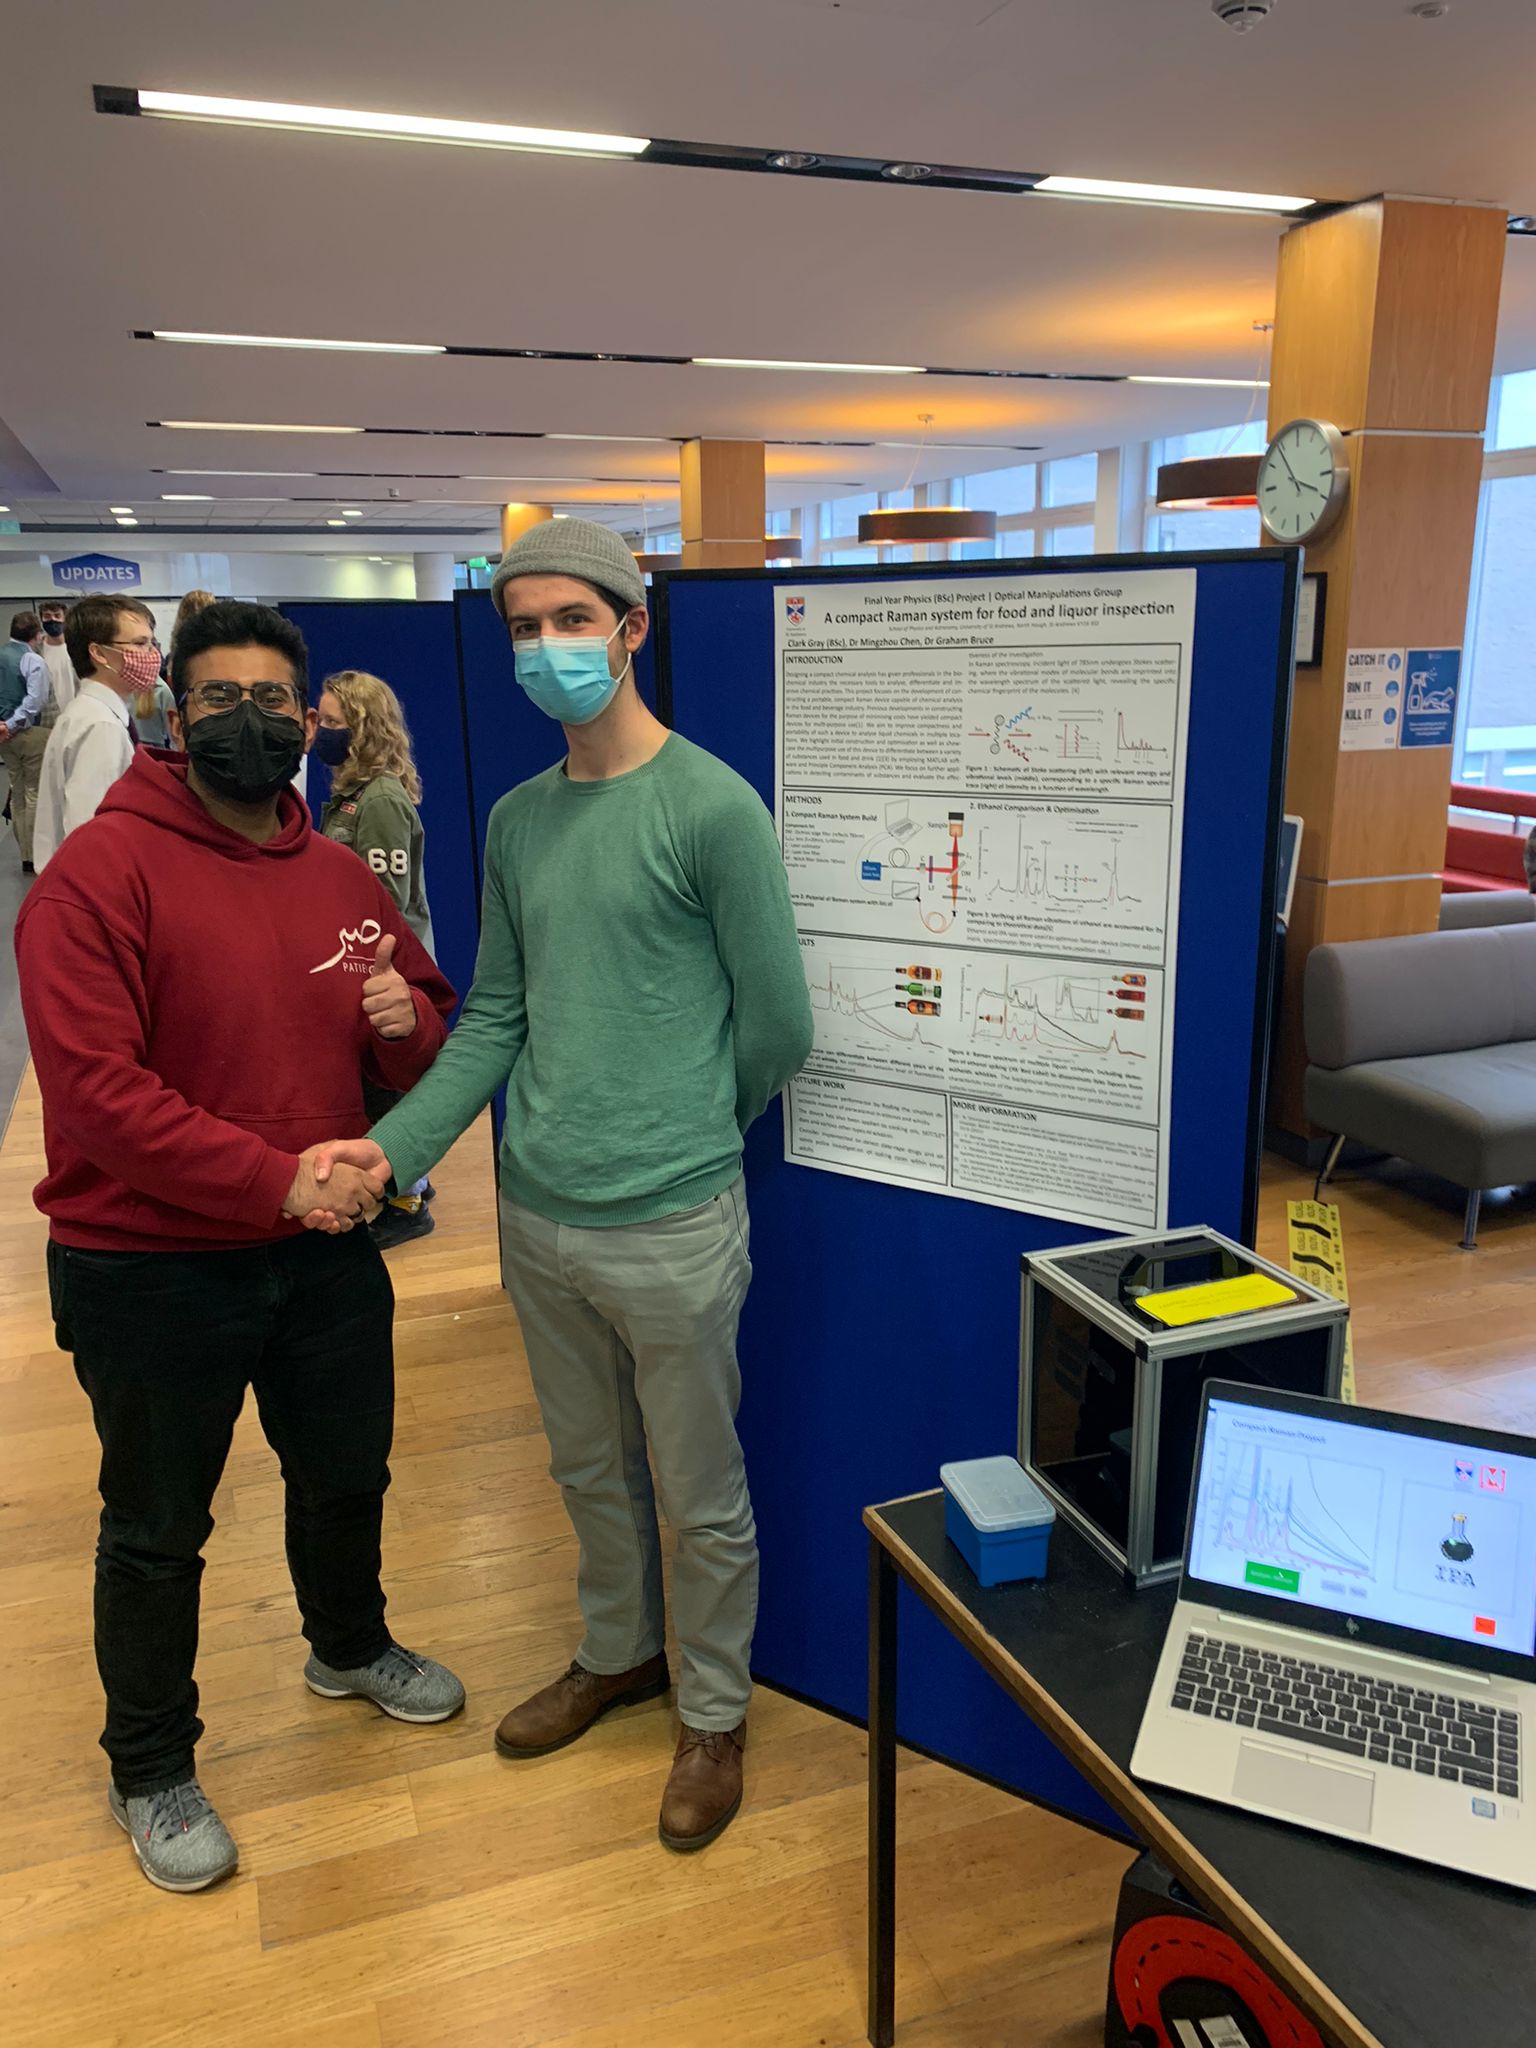
May 2022, at the Physics Final Year Masters Demonstrating Session. I was the first candidate to take their project out of the lab and demonstrate it to the Faculty. On finishing the project and demonstrating to the the rest of the faculty, a potential buyer proposed to purchase the device. Sadly, it was not for sale and I had to break the bad news after shaking hands. (I hated wearing the masks!)
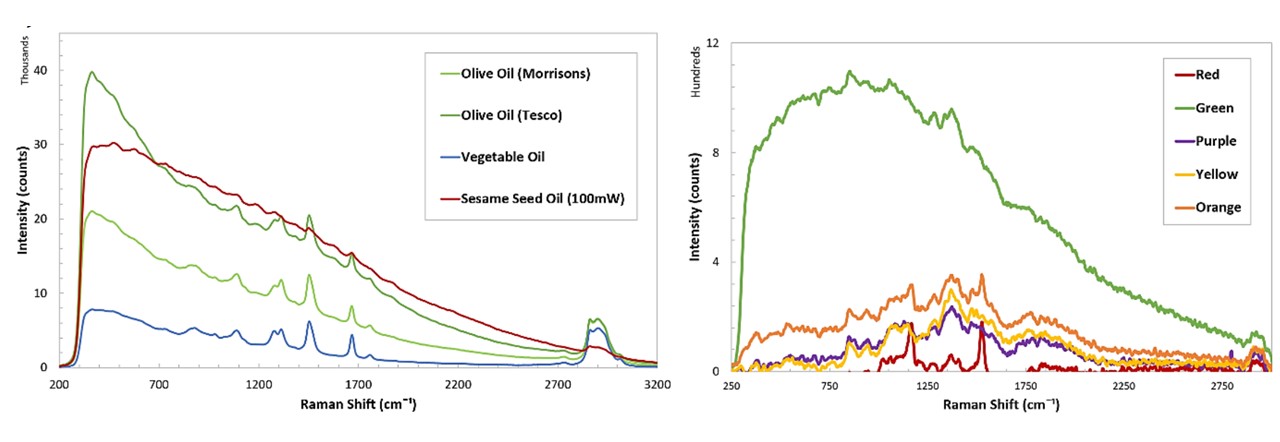
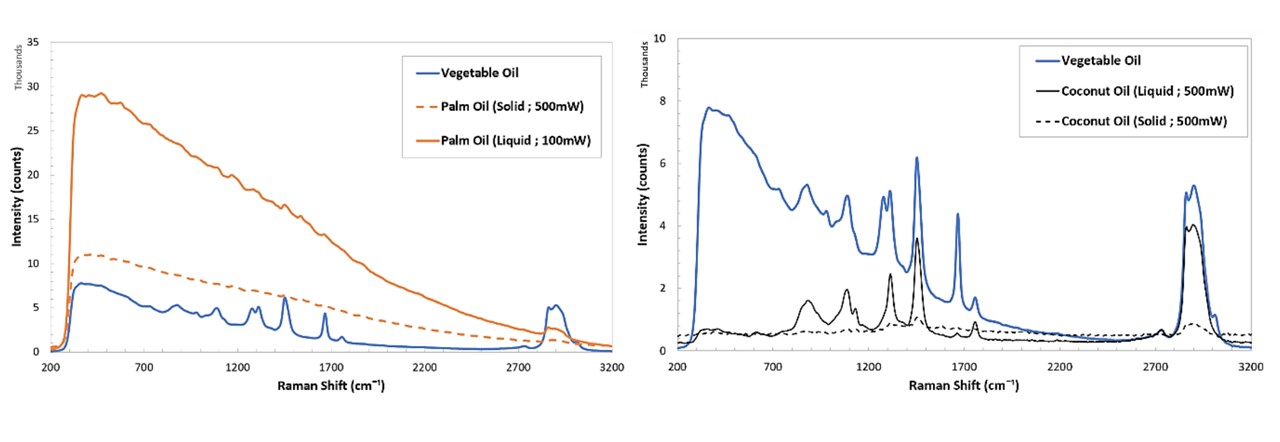
Figure C.4: Spectrums of various samples; cooking oils (top left), SKITTLES®, as well as cooking oils, namely palm oil and coconut oil at solid and liquid states (bottom).
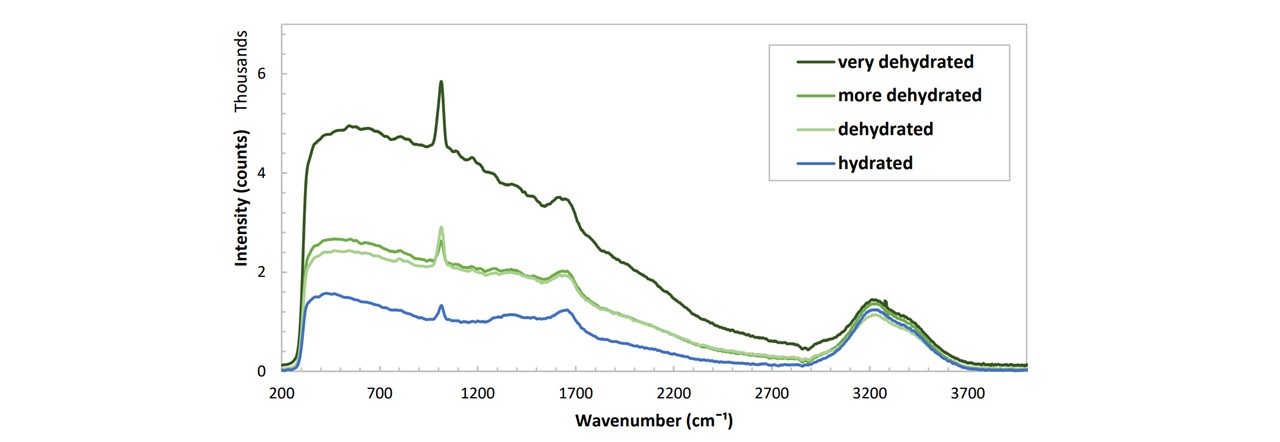
Figure C.5: Spectrums of various urine samples prepared by an anonymous student at various stages of hydration levels. The hydration level was measured qualitatively based on the student’s wellbeing. (Don't ask how I got the sample :) )
_________________________________________________________________________________________
And there we have it. If there is material, ideas or any projects which you are proud of, don't hesitate to publish it out for the world to see. There are many projects I did during my undergraduate which I didn't publish.
References
(1) G-Biosciences! © 2021 Geno Technology Inc. USA, 20-02-2022- https://info.gbiosciences.com/blog/bid/182082/protein-labelling-101- understanding-the-basics
(2) E.V. Elslande, S. Lecomte, and A. L. Ho, Micro-Raman spectroscopy (MRS) and surface-enhanced Raman scattering (SERS) on organic colourants in archaeological pigments., Journal of Raman Spectroscopy, 2008, p. 39: 1001.
(3) V. Baron and M. Chen, Label-free optical vibrational spectroscopy to detect the metabolic state of M. tuberculosis cells at the site of disease, Scientific Reports, 2017 p. 7: 9844.
(4) L. Woolford and M. Chen, Towards automated cancer screening: Label-free classification of fixed cell samples using wavelength modulated Raman spectroscopy, Journal of BioPhotonics, 2017
(5) Huang, Chia-Chi, Applications of Raman spectroscopy in herbal medicine, Applied Spectroscopy Reviews, 2015, pp. 51:1, 1-11.
(6) Kishan Dholakia, Optical spectroscopic analysis for the discrimination of extra-virgin olive oil, Applied Spectroscopy, 2016, Vol. 70(11) p.1872–1882 .
(7) A. Philippidis, Comparative study using Raman and Visible Spectroscopy of cretan extra virgin olive oil adulteration with sunflower oil, Analytical Letters, 2017, pp. 50:7, 1182-1195 .
(8) Holly Fleming, Mingzhou Chen, Through-bottle whisky sensing and classification using Raman spectroscopy in an axicon-based backscattering configuration, Analytical Methods, 2020, pp. 12, 4572 .
(9) Vera Deneva, Using Raman Spectroscopy as a fast tool to classify and analyze Bulgarian wines—a feasibility study, 2020, Molecules, pp. 25, 170 .
(10) Ramdas, G. Venkataraman and Anant Krishna, Illuminating the Life and Science of Chandrasekhara V. Raman, Journey into Light: Life and Science of C. V. Raman, 1989, Physics Today , pp. 42, 12, 61.
(11) Gardiner, DJ. Practical Raman spectroscopy, Springer-Verlag, 1989, ISBN 978-0-387-50254-0
(12) Bertolucci, Harris and. Symmetry and Spectroscopy, Dover Publications, 1989, ISBN 978-0-486- 66144-5. p92, Vibrational Spectrscopy.
(13) Using Raman Spectroscopy to Assist in the REACH Registration of Gases. Kaiser Optical Systems, Inc., 07-04-2022- https://www.azom.com/article.aspx?ArticleID=12431
(14) Shimanouchi, Takehiko. Tables of Molecular Vibrational Frequencies Consolidated, Volume 1, Department of Chemistry Faculty of Science University of Tokyo, 1972, Tokyo
(15) Application Note - Fluorescence 01, HORIBA Jobin Yvon, 20-02-2022. https://www.horiba.com/fileadmin/uploads/Scientific/Documents/Raman/Fluorescence01.pdf
(16) Ganshang Si, A new eye-safe compact UV-Raman spectroscopy setup for the proximal detection of hazardous chemicals, SPIE Digital Library, 2021.
(17) N. Emmanuel, Fabricating a low-cost Raman spectrometer to introduce students to spectroscopy basics and applied instrument design, Journal of Chemical Education, 2021, pp. 98, 2109—2116 .
(18) Semrock, 785 nm MaxLine® laser clean-up filter, 07-04-22 http://www.semrock.com/filterdetails.aspx?id=ll01-785-12.5 (19) Pfeilsticker, U. Platt, Optical Phenomena in the Atmosphere, Research Gate , 2013, Figure 23.1 (a),
(20) Ocean Insight, Preconfigured Maya2000 Pro Series -07-04- 2022[https://www.oceaninsight.com/products/spectrometers/high-sensitivity/maya-series/](https://www.oceaninsight.com/products/spectrometers/high-sensitivity/maya-series/)
(21) Peter J. Berryman and David A. Faux , Solvation pressure in ethanol by molecular dynamics simulations,, Physical Review, 2007, Vol. B. p. 76:104303.
(22) The Whisky Professor, 'Does whisky change in an unopened bottle?'', - 29-03-2022, [https://scotchwhisky.com/magazine/ask-the-professor/16942/does-whisky-change-in-an-unopened-bottle/](https://scotchwhisky.com/magazine/ask-the-professor/16942/does-whisky-change-in-an-unopened-bottle/)
(23) MedsNews, 'Is it dangerous to use paracetamol and alcohol?', 29-04-2022, [https://www.medsnews.com/health/is-it-dangerous-to-use-paracetamol-and-alcohol](https://www.medsnews.com/health/is-it-dangerous-to-use-paracetamol-and-alcohol)
(24) 30 mm Cage Cube, THORLABS, 07-04-2022, https://www.thorlabs.com/thorproduct.cfm?partnumber=CM1-DCH/M
(25) Compact Cage Plate THORLABS, 07-04-2022, http://www.thorlabs.com/thorproduct.cfm?partnumber=SP02 (26) Cage Adapter Plate, THORLABS, 07-04-2022, http://www.thorlabs.com/thorproduct.cfm?partnumber=SP05/M
(27) 30 mm Threaded Cage Plate,THORLABS, 07-04-2022, http://www.thorlabs.com/thorproduct.cfm?partnumber=CP33
(28) Right-Angle Elliptical Mirror Mount, THORLABS, 07-04-2022, http://www.thorlabs.com/thorproduct.cfm?partnumber= KCB05E/M
(29) Mounted Plano-Convex Lenses, THORLABS, 07-04-2022, http://www.thorlabs.com/newgrouppage9.cfm?objectgroup_id=6278&pn=LA1074- B-ML
(30) 20mm focal length Plano Convex Lens, THORLABS, 07-04-2022, https://www.thorlabs.com/thorproduct.cfm?partnumber=LA1074-B-ML
(31) 50mm focal length,THORLABS, 07-04-2022, www.thorlabs.com/thorproduct.cfm?partnumber= LA1213-B-ML. https://www.thorlabs.com/thorproduct.cfm?partnumber=%20LA1213- B-ML
(32) Cleaning Optical Filter, Semrock, 07-04-2022,[http://www.semrock.com/cleaning-optical-filters.aspx](http://www.semrock.com/cleaning-optical-filters.aspx)
(33) Filter Orientation, Semrock, FAQs, [https://www.semrock.com/technical-faq.aspx#:~:text=For%20microscopes%2C%20the%20exciter%20filter,eye%2C%20d](https://www.semrock.com/technical-faq.aspx#:~:text=For%20microscopes%2C%20the%20exciter%20filter,eye%2C%20d) etector%2C%20or%20camera
(34) 785 nm StopLine® single-notch filter, Semrock, 07-04-2022, http://www.semrock.com/filterdetails.aspx?id=nf03-785e-25
(35) 785 nm RazorEdge Dichroic™ laser beamsplitter, Semrock, 07-04-2022, https://www.semrock.com/filterdetails.aspx?id=lpd02-785ru-25
(36) Broadband Dielectric Elliptical Mirror, THORLABS, 07-04-2022, https://www.thorlabs.com/thorproduct.cfm?partnumber=BBE05-E03
(37) Fiber Collimation, THORLABS, 07-04-2022, https://www.thorlabs.com/thorproduct.cfm?partnumber=F220SMA-780 (
- Divergence Measurements, THORLABS, 07-04-2022, https://www.thorlabs.com/newgrouppage9.cfm?objectgroup_id=355#5964
(39) LuxxMaster™ LML Series, Laser Components, 07-04-2022, https://www.lasercomponents.com/uk/news/luxxmasterTM-lml-series/
(40) Ø200 µm Fiber Patch Cable, THORLABS, 07-04-2022, http://www.thorlabs.com/thorproduct.cfm?partnumber=M44L01
(41) LuxxMaster LML Series, Butterfly PDF, 07-04-2022, https://www.lasercomponents.com/de/?embedded=1&file=fileadmin/user_upload /home/Datasheets/pd_ld/luxxmaster_785nm_butterfly.pdf&no_cache=1
(42) William M. Hayes, CRC Handbook of Chemistry and Physics, Bacon Raton, 2011 (92nd edition), p3.246, ISBN: 1-4398-5511-0
(43) Kidney stones under a microscope, Research Gate, 07-04-2022- [https://www.researchgate.net/figure/Microscopic-images-of-kidney-sections-under-light-microscope-100x-after-Pizzolatos_fig2_312517114](https://www.researchgate.net/figure/Microscopic-images-of-kidney-sections-under-light-microscope-100x-after-Pizzolatos_fig2_312517114)